|
|
|
Newsletter June 2017 |
|
Microarray image analysis – Effective background noise processing based on spot morphology |
|
|
Noise processing is a crucial step in microarray image analysis. If noise misleads the spots’ pattern, it may fail subsequent procedures such as grid alignment and spot finding. This newsletter discusses a background noise processing technique based on spot morphology which has proved successful for a variety of microarray image data. We illustrate the technique with a slide image (Figure 1, left) in which the background signal varies across the slide. Our objective is to extract the background “layer” (Figure 1, middle), so that only the spot signal remains (Figure 1, right). 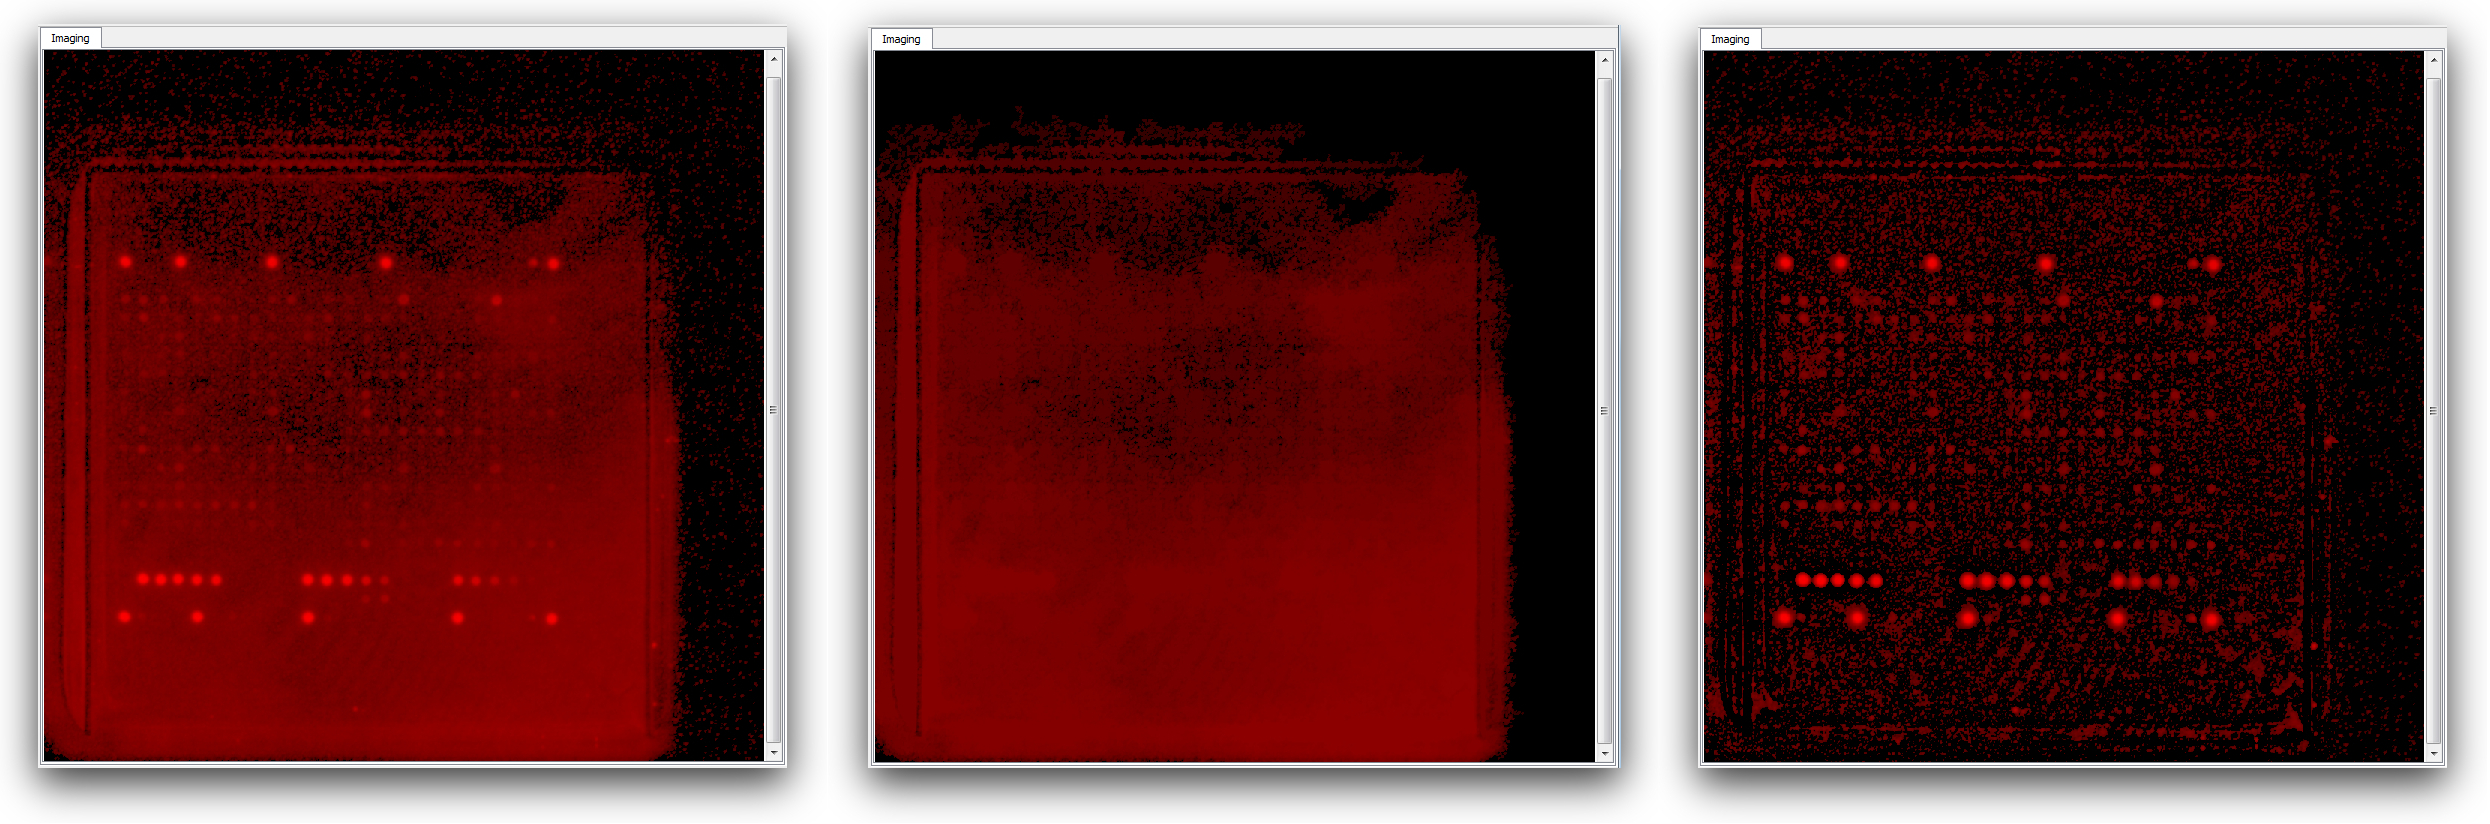
Figure 1. Slides images (left to right): original-, background-, and background-corrected data. |
|
Noise processing based on spot morphologyWe observe that the spots' signal is confined to the “square” defined by the horizontal and vertical spacing between two spots. Imagine a microarray image is a matrix of “cones”, we will use this square to cut out part of the cone that fits within the square; the remaining becomes the background layer. You can watch the video describing the technique on YouTube by clicking on any of the following images. Consider a block of 9 spots being arranged in 3 rows and 3 columns. Their original intensity profile is shown in gray (Figure 2). 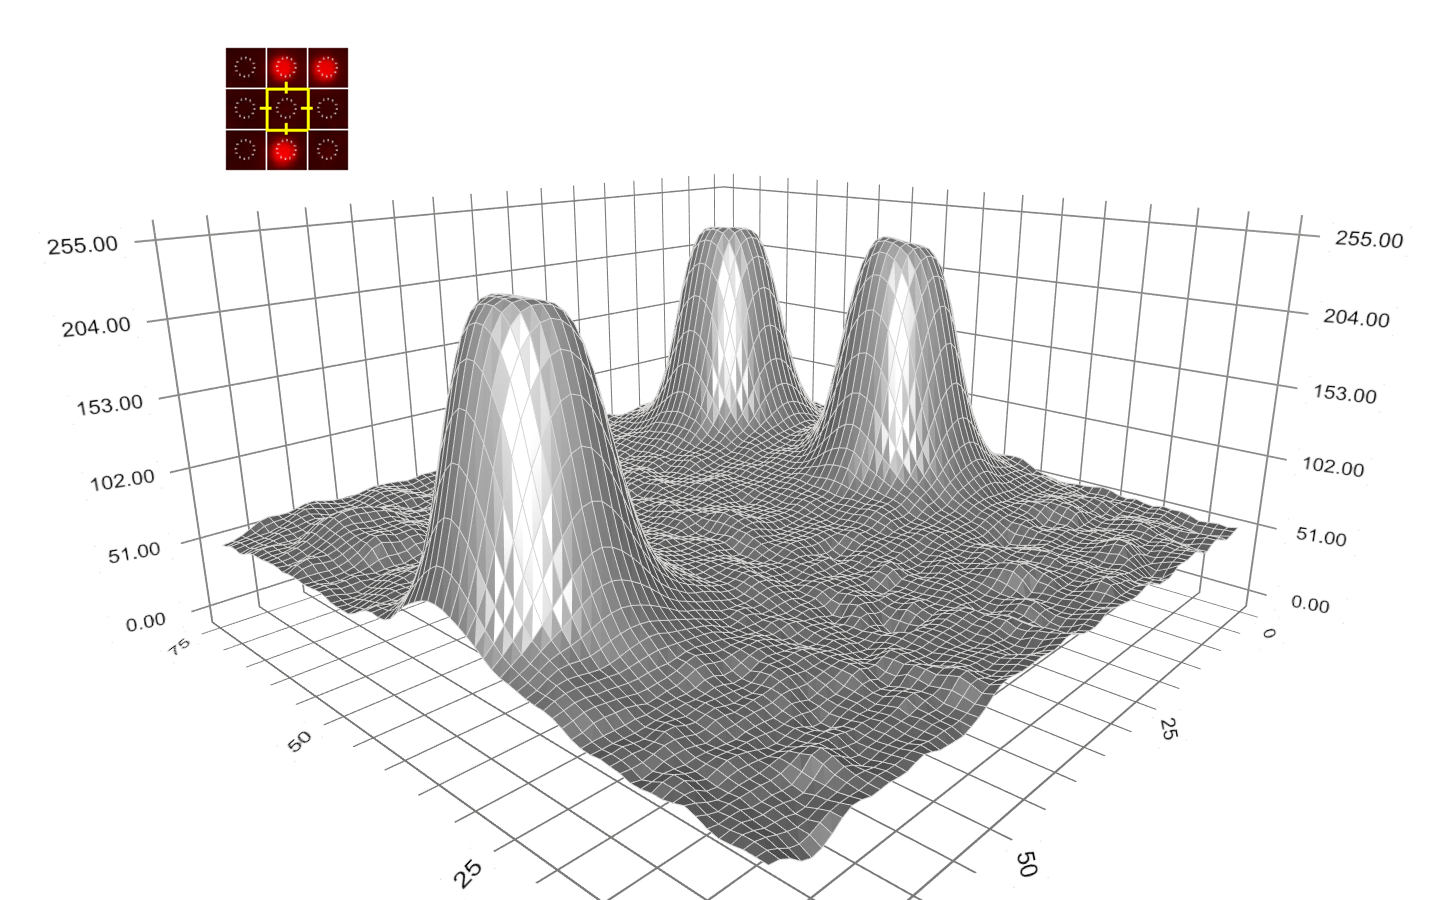
Figure 2. Spot intensity profiles from original image data. Based on spot morphology, the background layer can be extracted and is illustrated in green (Figure 3, Figure 4). 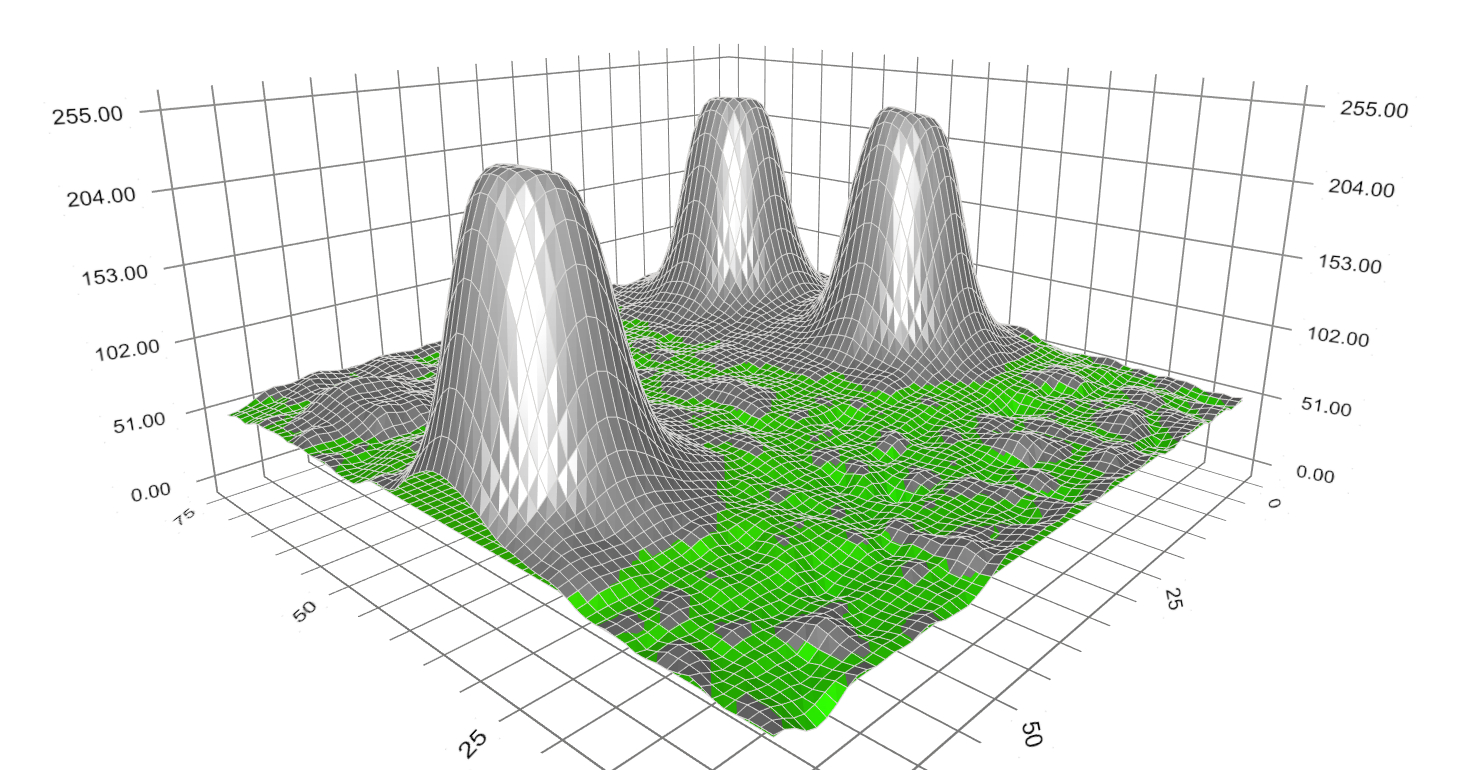
Figure 3. Background layer together with original data. 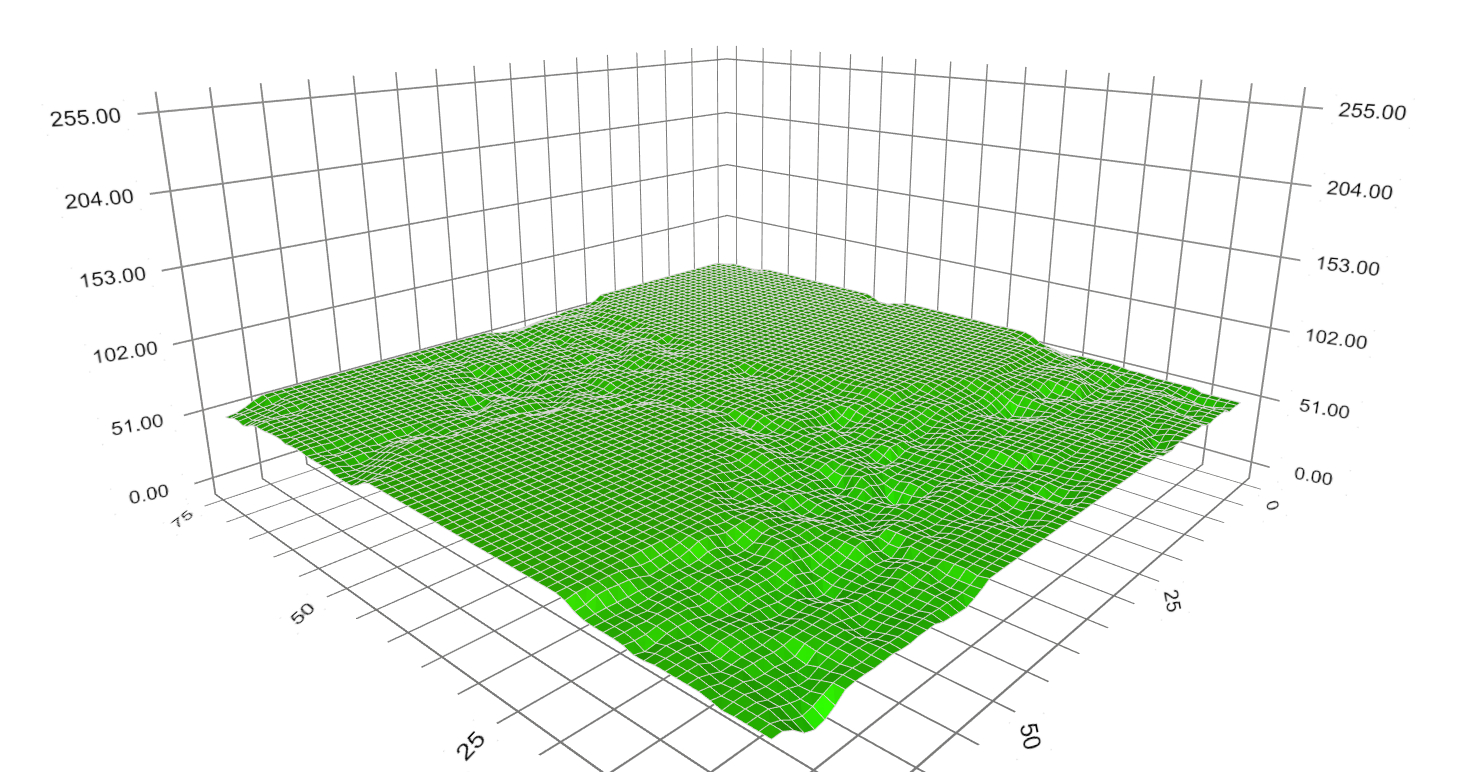
Figure 4. Extracted background layer. How to do that? We make use of the fact that the spot signal is confined to the square defined by the spot vertical and horizontal spacing, which are 25 pixels here. The background is thus obtained by cutting out peaks whose width smaller than 25 pixels in the original profile (Figure 5). 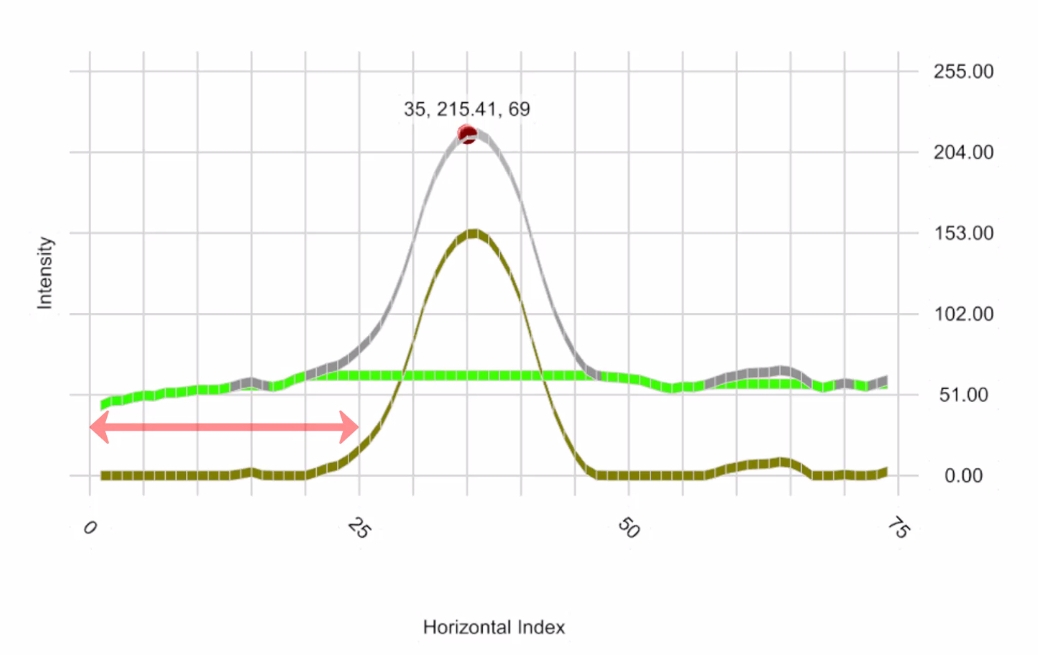
Figure 5. A slice of original, background, and foreground signal on horizontal axis. Finally, we subtract the background from the original signal to get the so-called foreground or the background-corrected signal. It is depicted in dark-yellow (Figure 6). 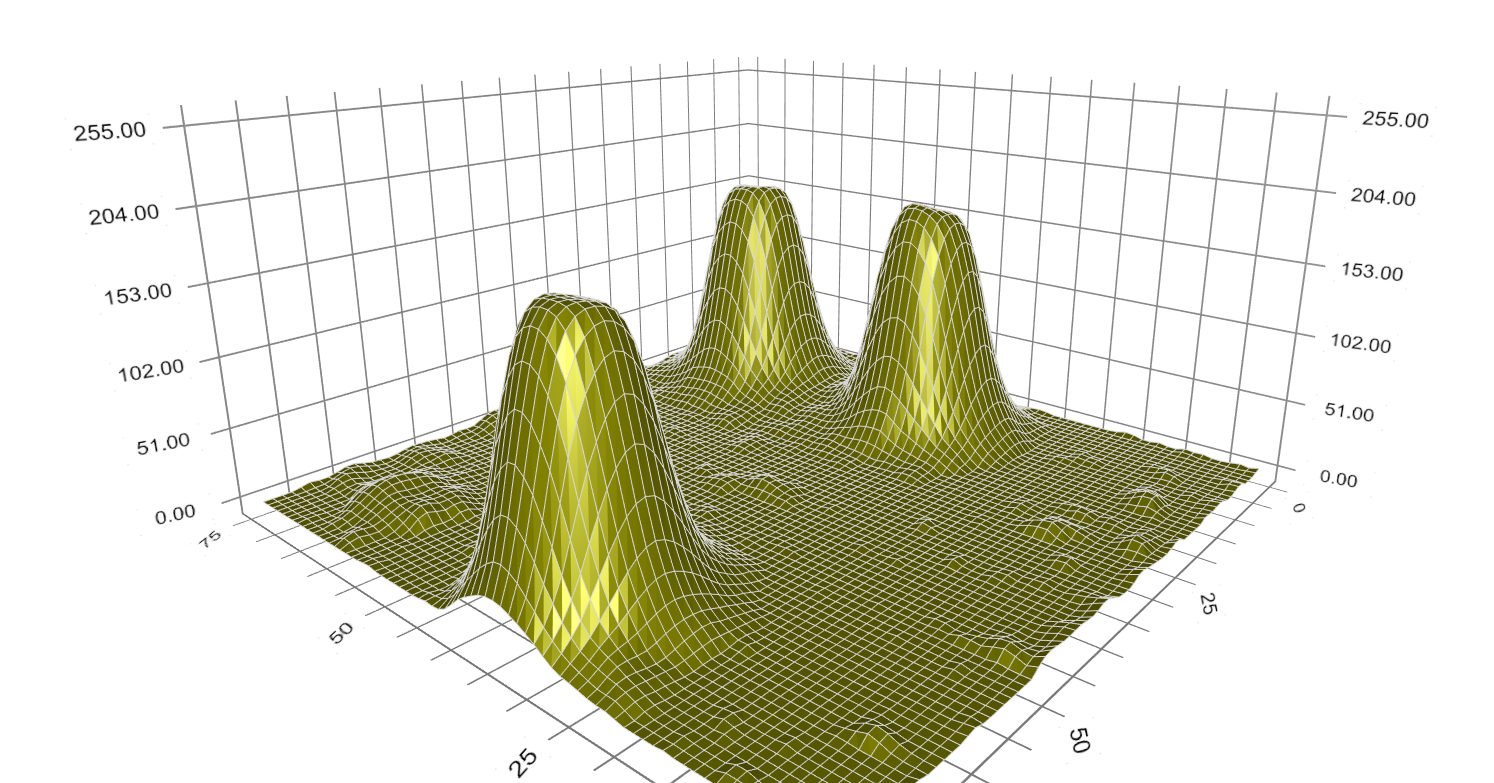
Figure 6. Background-corrected spot intensity profiles. (You can watch the video describing the technique on YouTube by clicking on any images.) |
|
ApplicationsThe technique has proved successful with microarray image data, but it could also be useful for image data containing objects in repeating patterns such as rows, columns, or matrices. For microarray images, this background noise processing is integrated in our software Spotxel (www.sicasys.de/spotxel), which can be tested for 14 days on Windows as well as Mac OS X computers. In the next newsletters, we will discuss microarray image analysis methods on spot finding and detection of errors such as smearing, merged-spots, fried-eggs, donuts. If you are interested but not yet in our mailing-list, simply subscribe here. |
|
|
©2017 Sicasys Software GmbH. All Rights Reserved. |
|
|
Sicasys Software GmbH |
Web: www.sicasys.de |