|
|
|
Newsletter August 2017 |
|
Microarray image analysis: Powerful detection of spot signal independent of shape & position |
|
|
When analyzing microarray images, we aim at identifying the spot signal, i.e. the pixels that truly represent the signal intensity of the gene, peptide, antibody, or protein printed at a spot. This process, called spot finding, determines the quality of the analysis. It is challenging, however, if the spot signal’s shape and intensity profile are diverse or the spot signal is shifted away from the originally printed position. In this newsletter, we present a powerful spot finding method based on boundary evolution and spot morphology. The technique is illustrated with an image (Figure 1, left) which has a diversity of spot shapes and intensity profiles. In addition, the spot signal is shifted from the originally printed position (Figure 1, dashed circles) in different directions. We would like to identify the spot signal and highlight its boundary in blue (Figure 1, right). 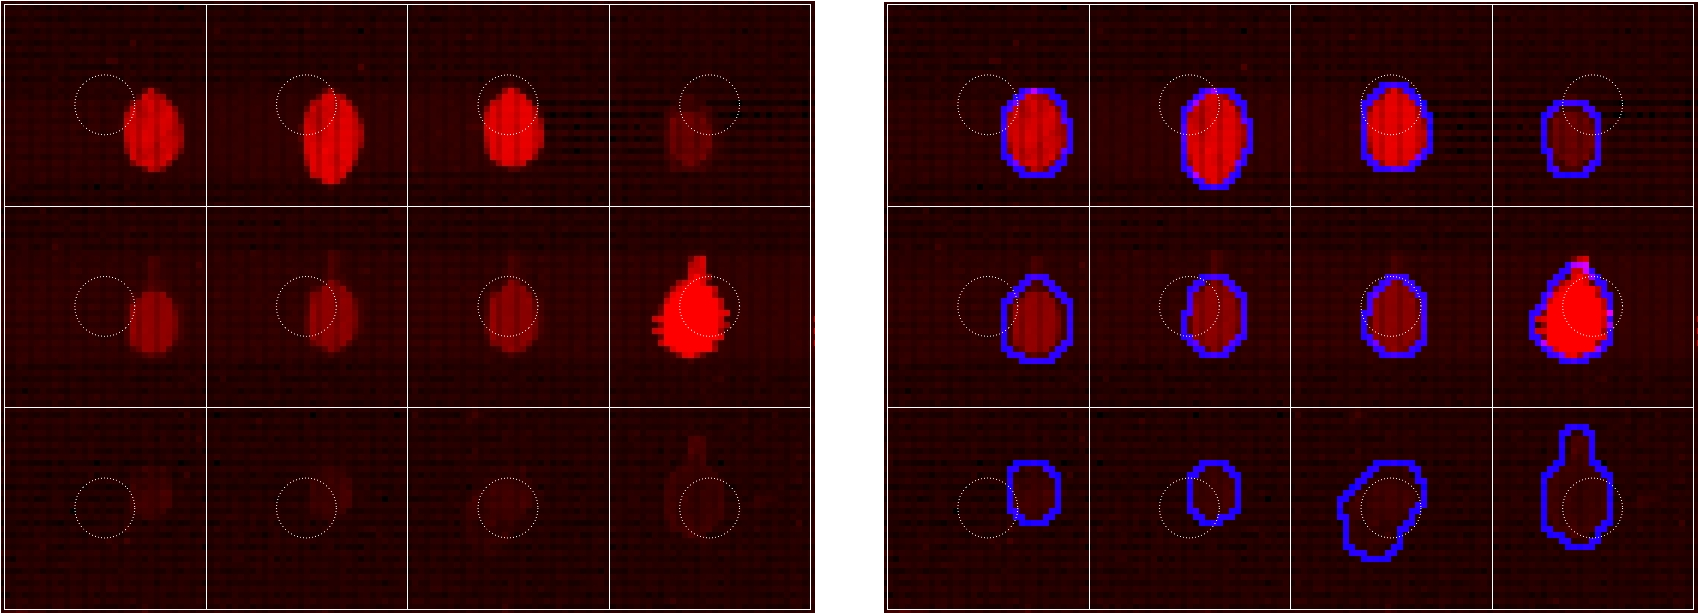
Figure 1: Original array image (left) and highlight of detected spot signal (right). Since the spot signal is shifted from the original printed position in different directions, it will fail methods such as fixed- or adapted-circle. On the other hand, various intensity profiles and the discontinuous background will fail intensity-based methods such as thresholding or clustering. Note that the boundary is necessary to separate the spot signal from the background pixels (for computing the signal-to-noise ratio) as well to determine measures of quality such as spot’s circularity and center. (Click on any image to watch the YouTube video – You can see more highlights and the 3D data from different viewing directions.) |
|
Spot finding based on boundary evolution and spot morphologyProblem formulationConsider the array image (Figure 1, left) consisting of 12 spots arranged in 3 rows and 4 columns. Here, each spot image is bounded by a white square whose size is the vertical- and horizontal spot spacing. We need to divide each spot image into two regions: spot signal and background. A simple spot image is illustrated in Figure 2; it is made of only two colors: gray background and the spot signal being a red disc. 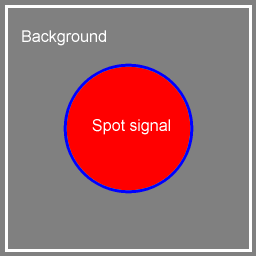
Figure 2: A simple spot image. We need a method that supports: (1) grouping pixels having similar intensity value into two regions that are separated by a boundary, and (2) the boundary being as close to the spot signal as possible. This is equivalent to searching for a boundary B, in the entire spot image I, that optimizes (1) and (2). It can be formulated by the following optimization problem: 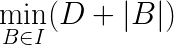
where I is the spot image, D is the measure of dissimilarity of pixels’ intensity value in the same region, and |B| is the length of the boundary. SolutionWith regard to solving the above optimization problem, the spot finding method works as follows:
Reducing D has the effect that the pixels in the spot signal region are more similar in terms of intensity value, and so are the pixels in the background region. Meanwhile, decreasing |B| makes the boundary smoother. Both result in a boundary closer to the spot signal region. Take the simple spot image in Figure 2 as example again. It can be immediately seen that the boundary, being initialized at the spot image border (i.e. the white square), will converge to the blue circle enclosing the disc. This holds true even if the disc’s size and position is changed. IllustrationConsider again our example with the array image in Figure 1 (left). The spots’ intensity profile is depicted in Figure 3. 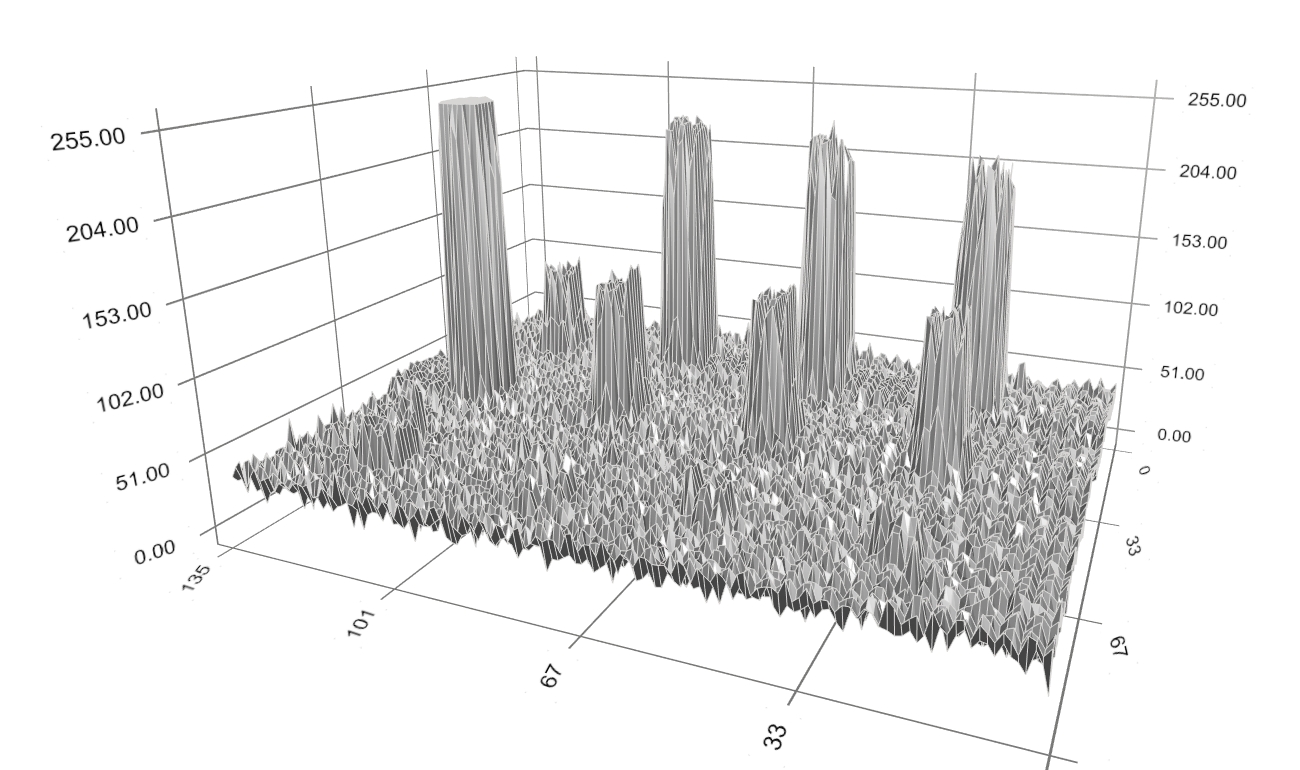
Figure 3: Original spot intensity profiles. We first apply the background noise processing technique that is based on spot morphology. The background-corrected intensity profiles are shown in dark-yellow in Figure 4. Note that there still remains noise of small size. 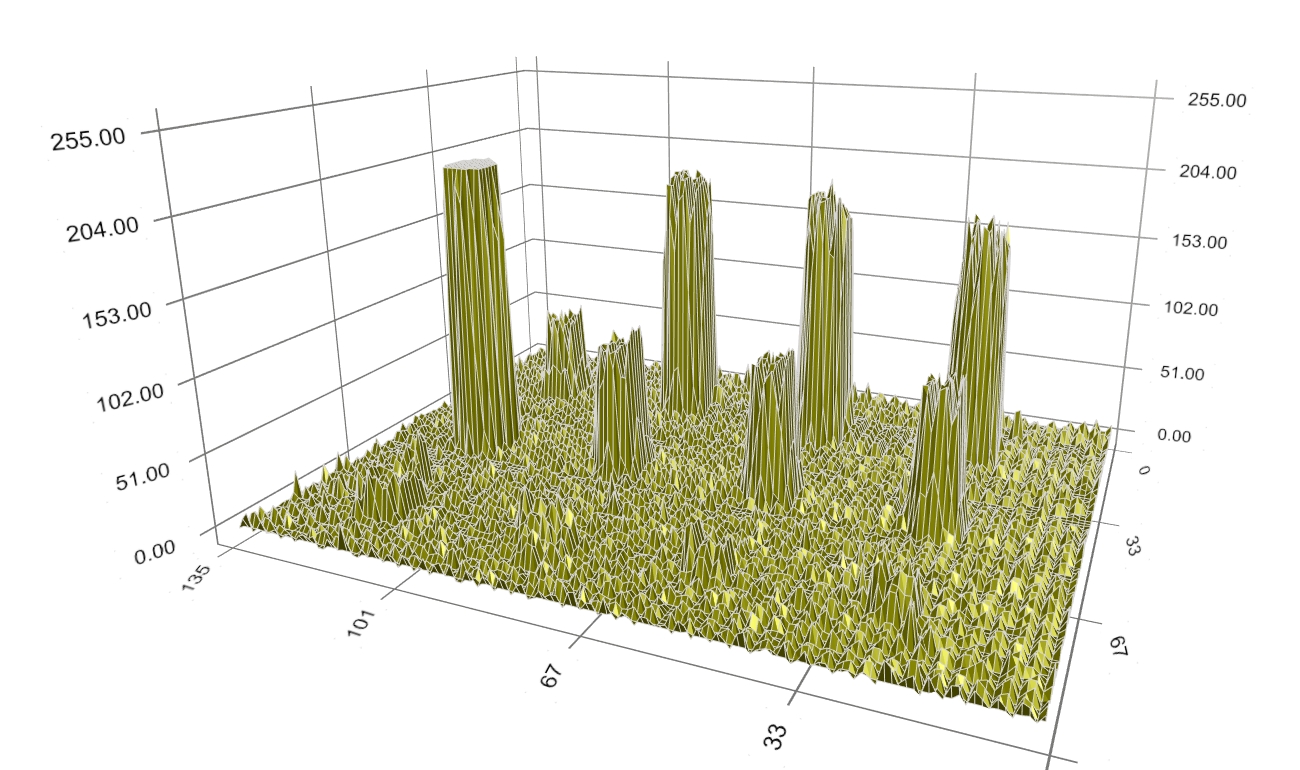
Figure 4: Background-corrected spot intensity profiles. At the beginning of the search, the boundary (shown in blue) is located at the border of each spot image (Figure 5). 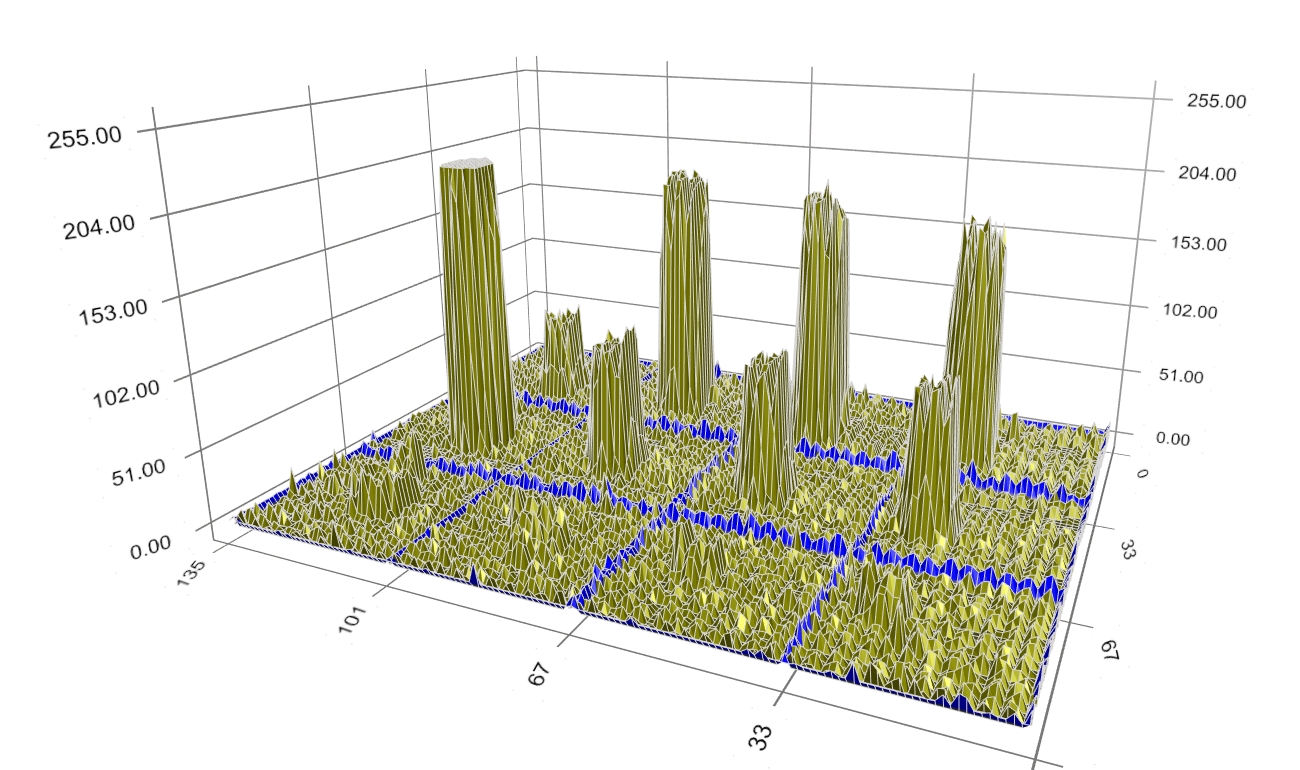
Figure 5: Initial boundaries. During evolution, the boundary moves closer to the spot signal (Figure 6) to reduce the dissimilarity of pixels within the blue boundary (i.e. the spot signal) and outside it (i.e. the background), as well as to shorten the boundary’s perimeter. 
Figure 6: An intermediate step of boundary evolution. The boundary keeps moving closer to the spot signal (Figure 7). However, some boundary still encloses noise being away from the spot signal. 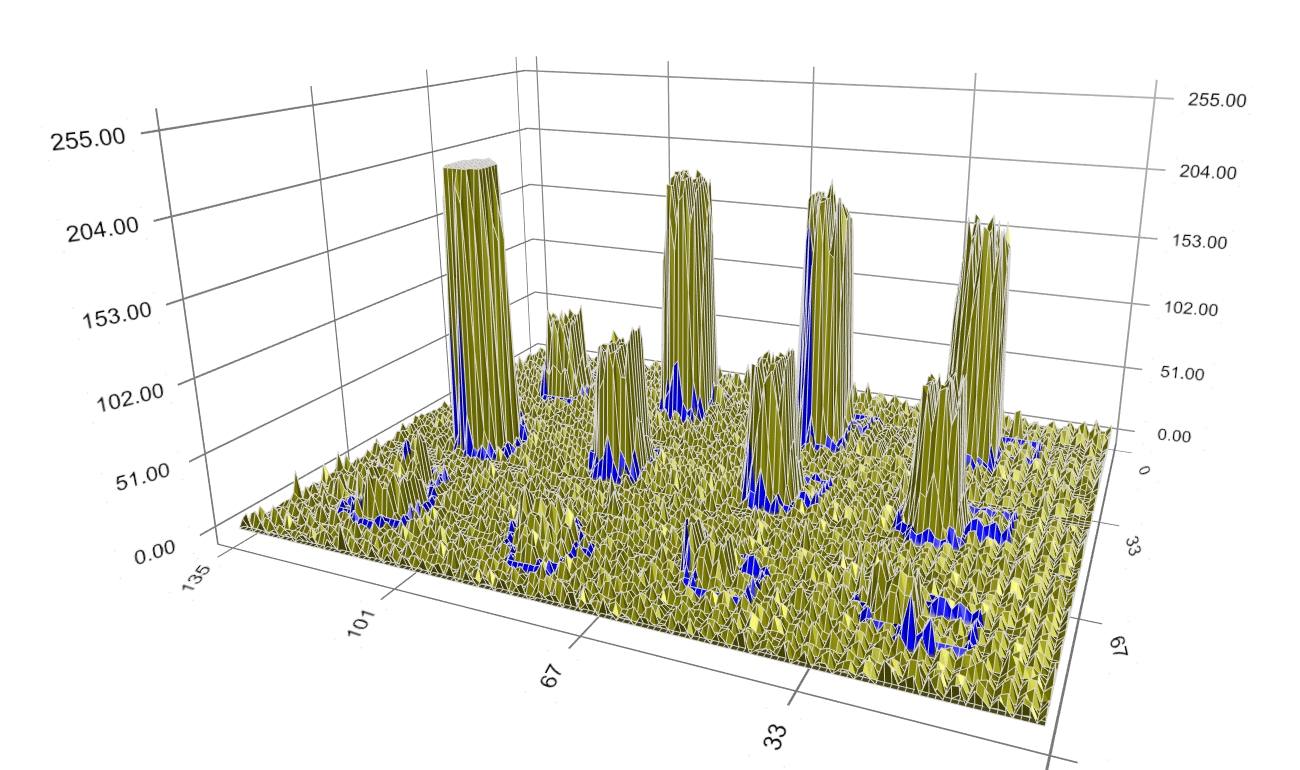
Figure 7: Another intermediate step of boundary evolution. Finally, when optimality is reached, the boundary converges at the border of the spot signal (Figure 8). 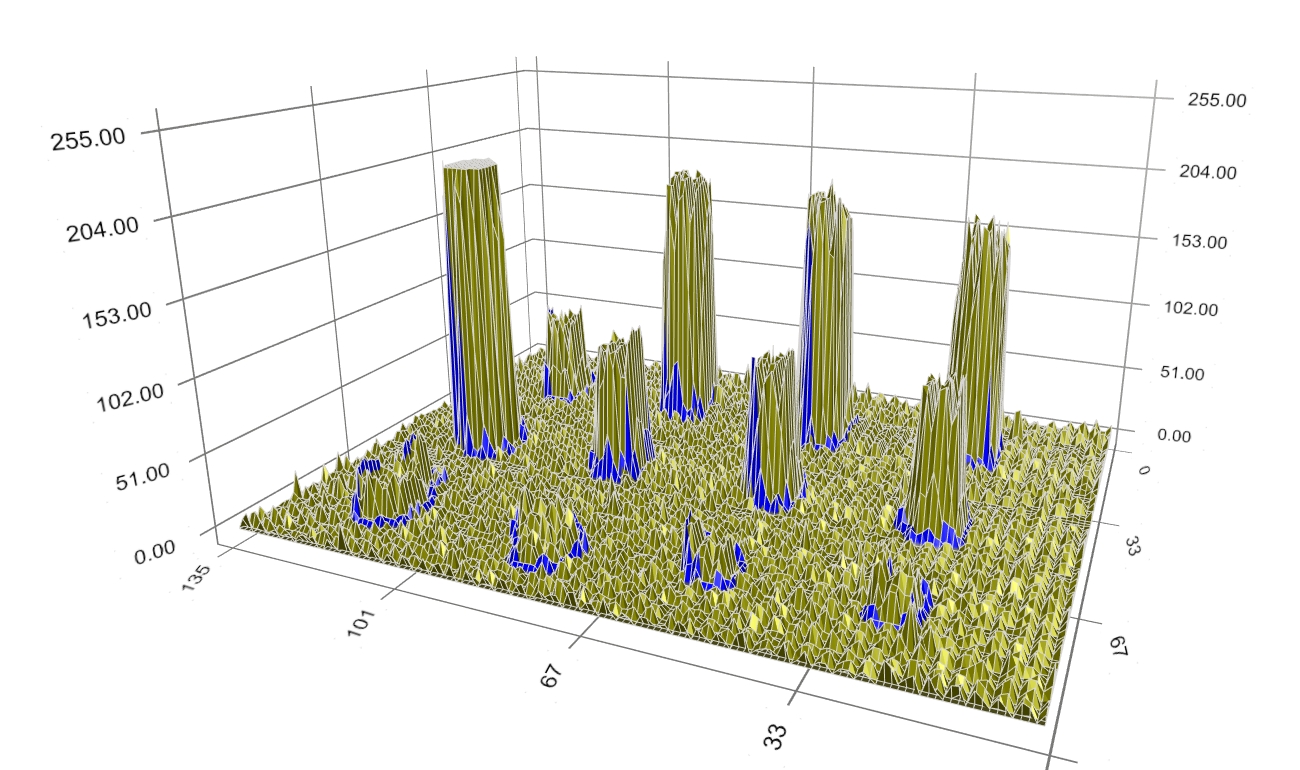
Figure 8: Converged boundary of spot signal. Figure 9 depicts the final spots’ boundary alone, representing the spot signal border. 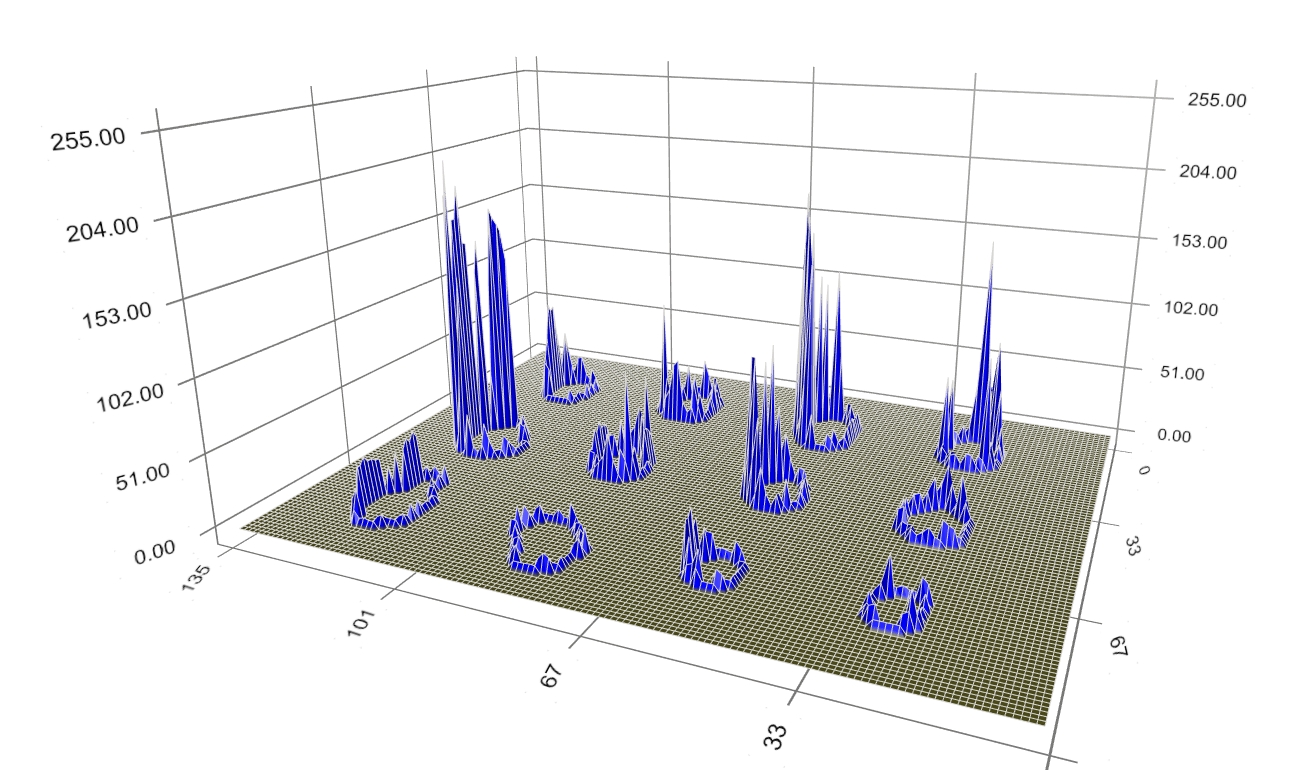
Figure 9: Boundary of spot signal. A top-view of the spots’ intensity profile and boundary is shown in Figure 10. Despite the diversity of intensity value, shape, and position of the spot signal, the method works as expected; the (blue) boundary clearly identifies the spot signal and separate it from the background. 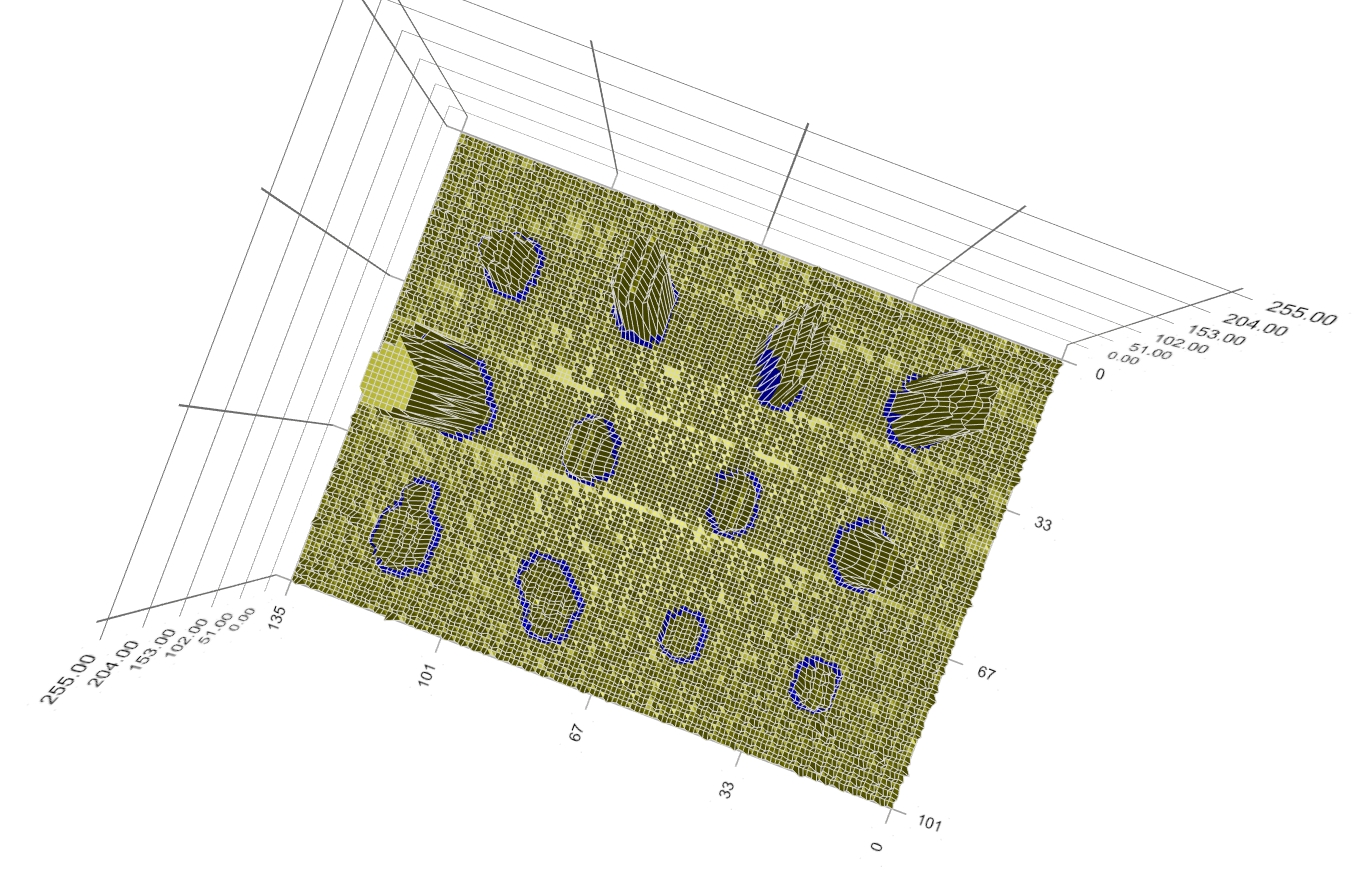
Figure 10: Top-view of spots’ intensity profile and boundary. (Click on any image to watch the YouTube video – You can see more highlights and the 3D data from different viewing directions.) |
|
ApplicationsWe have presented a powerful spot finding method based on boundary evolution. In fact, it is used as an object detection technique in many computer vision applications. Our spot finding also employs a background noise processing procedure based on spot morphology. For microarray image analysis, these spot finding and background noise processing methods are integrated in our software Spotxel® (www.sicasys.de/spotxel), which can be tested for 14 days on Windows as well as on Mac OS X computers. |
|
|
©2017 Sicasys Software GmbH. All Rights Reserved. |
|
|
Sicasys Software GmbH |
Web: www.sicasys.de |