Microarray Image and Data Analysis Software
Spotxel® Microarray provides user-friendly and intuitive tools for comprehensive microarray image and data analysis, catering to protein microarrays, antibody microarrays, peptide microarrays, and gene microarrays. The software offers robust features including image analysis, automated processing of multiple images, replicate processing, data filtering, and data normalization. These capabilities significantly enhance data quality and reliability, enabling the identification of key features and samples, and facilitating the exploration of their relationships through advanced data mining tools.
Spotxel® Microarray is compatible with both Windows and macOS platforms, ensuring seamless integration into your existing workflow.
Key Features:
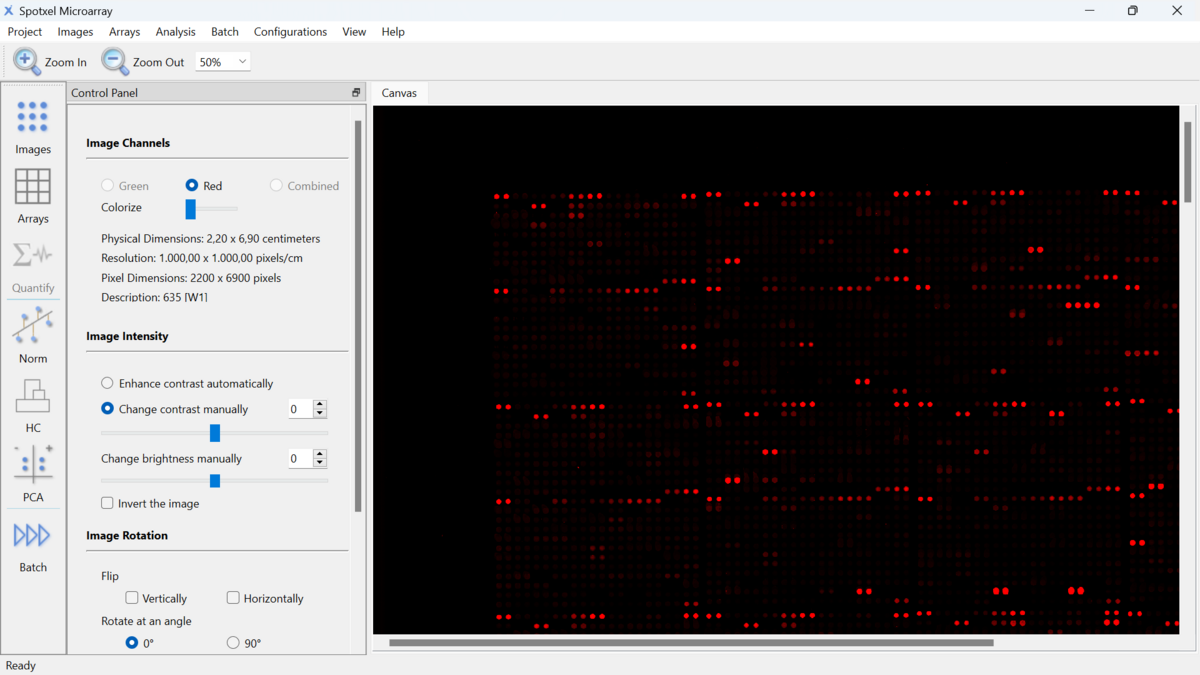
- Microarray Image Handling: Provides robust tools for the efficient loading and viewing of microarray images, available immediately upon installation at no cost.
- GAL Array Editor Module: Offers a comprehensive and user-friendly interface for editing array design and layout files, accessible for free upon software installation.
- Premium Features: Enables advanced functionalities including data quantification, automated array alignment, high-throughput batch processing of multiple images, replicate processing, data filtering, and data normalization, available with a licensed version.
Selected Publications using Spotxel® Microarray
- Molinos-Albert LM, Baquero E, Planchais C, et al. Structural basis for hepatitis E virus neutralization by potent human antibodies . Science Advances. 2025.
- Toshkova N, Zhelyzkova V, Reyes-Ruiz A, et al. Temperature sensitivity of bat antibodies links metabolic state of bats with antigen-recognition diversity . Nature Communications. 2024.
- Molinos-Albert LM, Planchais C, et al. Anti-V1/V3-glycan broadly HIV-1 neutralizing antibodies in a post-treatment controller . Cell Host & Microbe. 2023.
- Planchais C, Fernández I, Bruel T, et al. Potent human broadly SARS-CoV-2–neutralizing IgA and IgG antibodies effective against Omicron BA.1 and BA.2 . Journal of Experimental Medicine. 2022.
- Poulsen TBG, Damgaard D, Jørgensen MM, et al. Identification of potential autoantigens in anti-CCP-positive and anti-CCP-negative rheumatoid arthritis using citrulline-specific protein arrays . Scientific Reports. 2021.
For a more comprehensive list of publications using the software, see the Publications page.
Discover the full capabilities of Spotxel® Microarray with a 14-day free trial. Download now for Windows or macOS and begin your trial instantly.
Additionally, you can access the subpages through the following links:


Key Benefits
A Quick and Easy Way to Handle Microarray Images and Data
- Spotxel Microarray streamlines the microarray image analysis process with just four simple steps: Load image(s), Load or create array, Align array, Quantify.
- The array alignment function works very well on microarray images with standard spot layout. For custom layouts, parameters are available for tuning.
- The batch processing feature reduces manual processing time of approximately 160 microarray images from 3 weeks to just 2-3 hours.
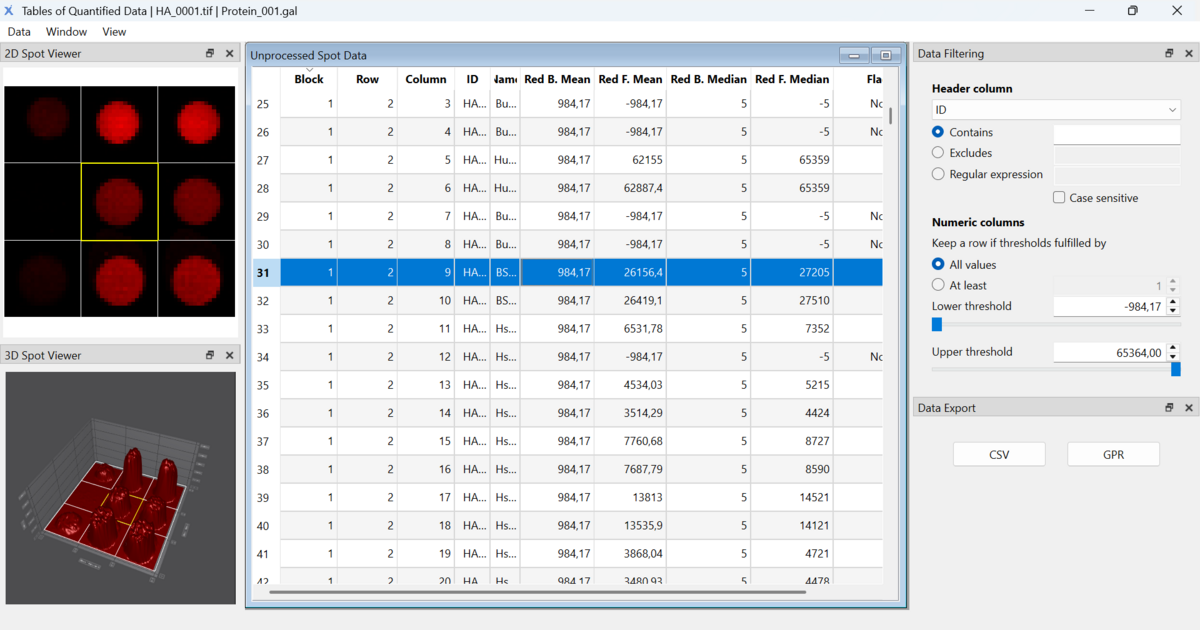
- Supports multiple screens, such as connecting a laptop to a monitor, for browsing quantified data or editing the array. Displaying the graphical canvas with array image on one screen and the data table on the other facilitates efficient analysis.
Ensure Data Quality
- Our advanced noise processing technology with background and foreground correction ensures high-quality results.
- The software also supports data filtering, normalization, and replicate processing tools to maintain data integrity.
Accurate Spot Detection
- The software leverages powerful detection algorithms that ensure accurate spot identification, even if shapes and positions deviate from specifications.
Cost-Effective Solutions
- Take advantage of free image handling and array editor tools.
- Start with a 14-day free trial to access premium functions.
- Choose from flexible licensing options: 3-month, 1-year, or time-unlimited models.
Seamless Compatibility and Tailored for Your Lab
The software is compatible with TIFF images from a variety of scanners and cameras, even those not specifically designed for microarrays:
- 8-bit, 16-bit, and 24-bit grayscale TIFF images.
- With or without resolution information.
- Single-page or multiple pages.
Seamlessly integrate Spotxel® Microarray into your existing workflow:
- Uses the widely adopted GAL format for array layouts.
- Supports both rectangular and hexagonal (orange packing) spot layout.
- Compatible with arrays stored as PepSlide Designer files (PSF) (*.psf).
- Exports results in CSV and GPR formats for easy downstream analysis.
Discover More About Spotxel® Microarray
Below, you will find YouTube videos showcasing the advancements in our software.