|
|
|
Newsletter November 2017 |
|
Spotxel® Reader: Smartphone-based colorimetric reader app for ELISA assays |
|
|
Smartphones are with us everywhere. Their processing power and camera quality keep getting better. Have you ever wanted to analyze some ELISA assays with your smartphone or tablet? Let’s do it with the Spotxel® Reader app. This article describes how the app supports the image capture and analysis of ELISA plates with a smartphone. Figure 1 shows the captured image of a 96-well plate. We would like to detect the blue signal in the wells and highlight its boundary in red (Figure 3, Figure 4). After quantifying, the wells’ color intensity is reported in a table format (Figure 5) and, as representative colors in a schematic plate (Figure 6). 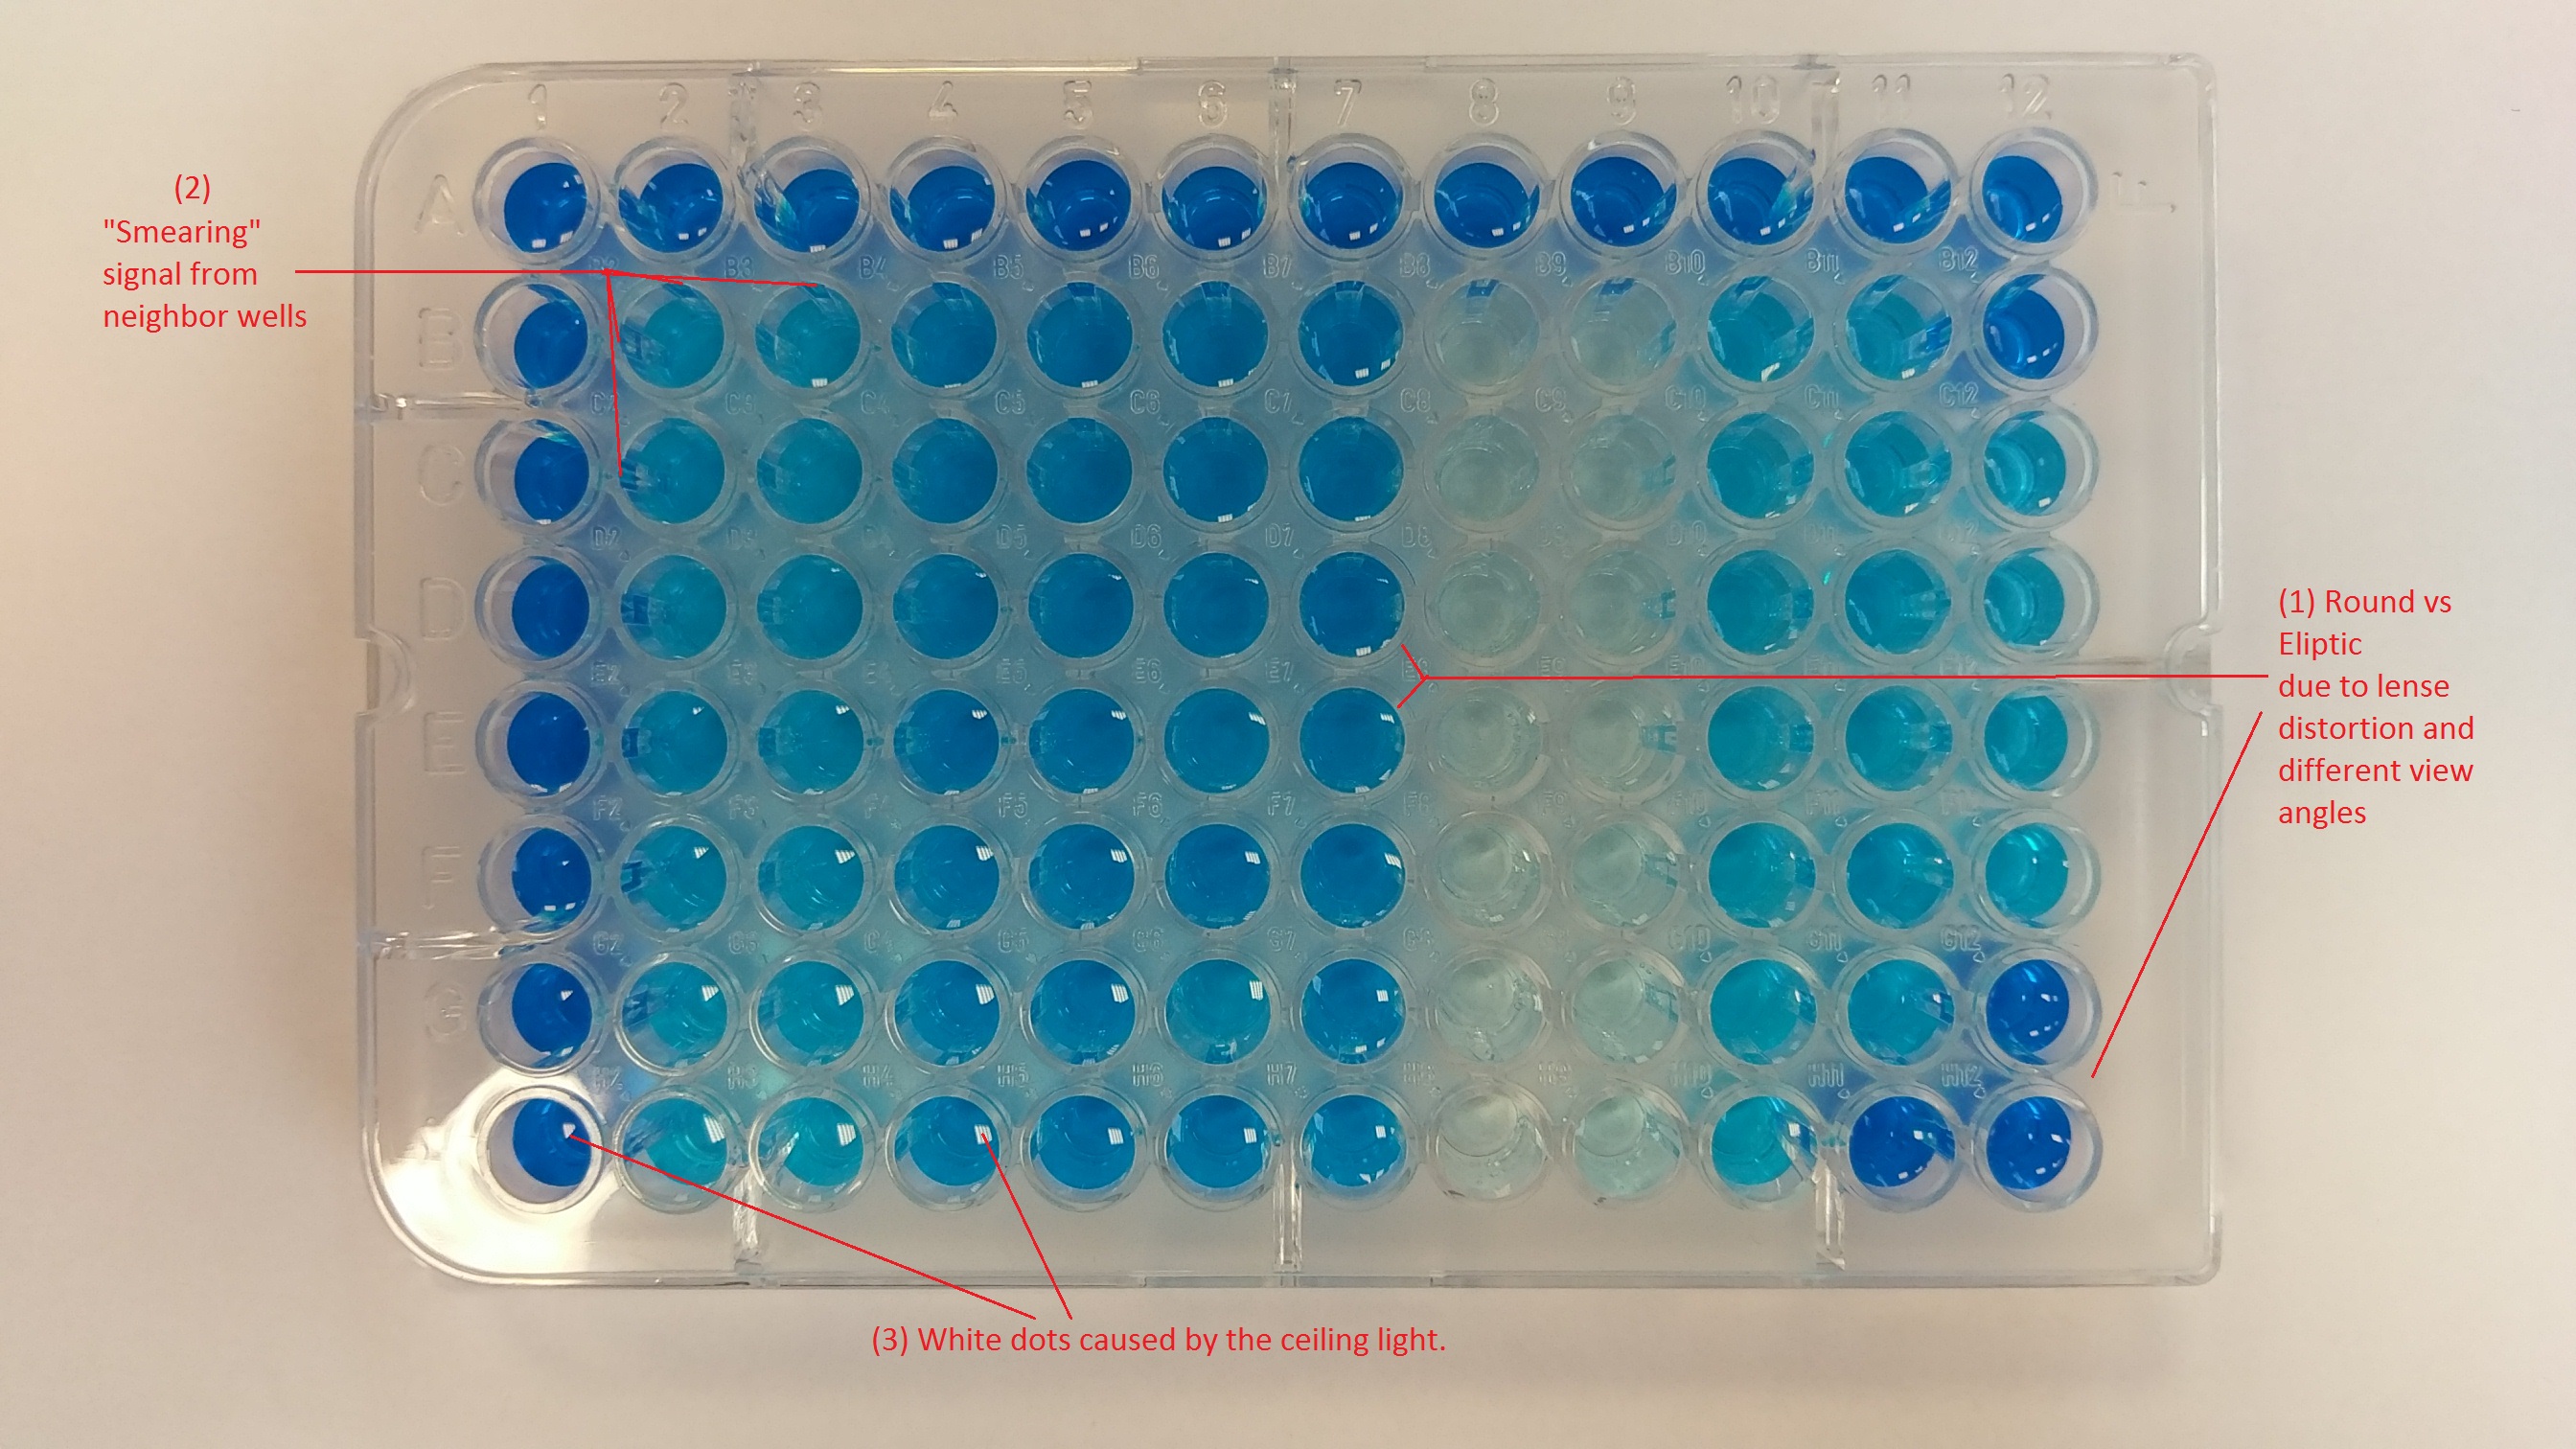
Figure 1: Microplate image. The image capture module could be calibrated to learn the camera hardware (e.g. the camera’s lens and color sensors) and the assay setup (e.g. the focus). This needs calibration plates and will be discussed another time. We focus now on the image analysis part, and assume that the images are captured with a single shot using the smartphone camera’s automatic settings. Images in this article are captured and analyzed with the app’s Android version. Support for iOS devices will be introduced later. |
|
Challenges to be addressedUnexpected artifacts should be detected and processed. These include: (1) Camera lens’ distortion effect and different view angles to the wells: The camera focuses at the plate’s center. Observe that the well signal at the plate center such as D6 or E7 is round, while those at the border such as A1 or G12 are elliptic.
(2) “Smearing” signal from neighbor wells: Consider well B2; the signal at its left side is due to well B1, while that at its top side is due to well A2.
(3) Noise: In this case, the white dots of different size caused by the ceiling light.
Plate annotation and alignmentThe wells are annotated, e.g. assigned an antibody name or ID, by entering the data directly into the table of wells’ signal data (Figure 5) or the schematic plate (Figure 6). The plate is then aligned with the image by overlaying a grid (Figure 2), comprising of 96 wells as black circles, with the signal in the image. The grid can be scaled and rotated if necessary. The camera lens’ distortion is reflected by the grid size. Grid alignment is done manually for the moment, but will be automated later. 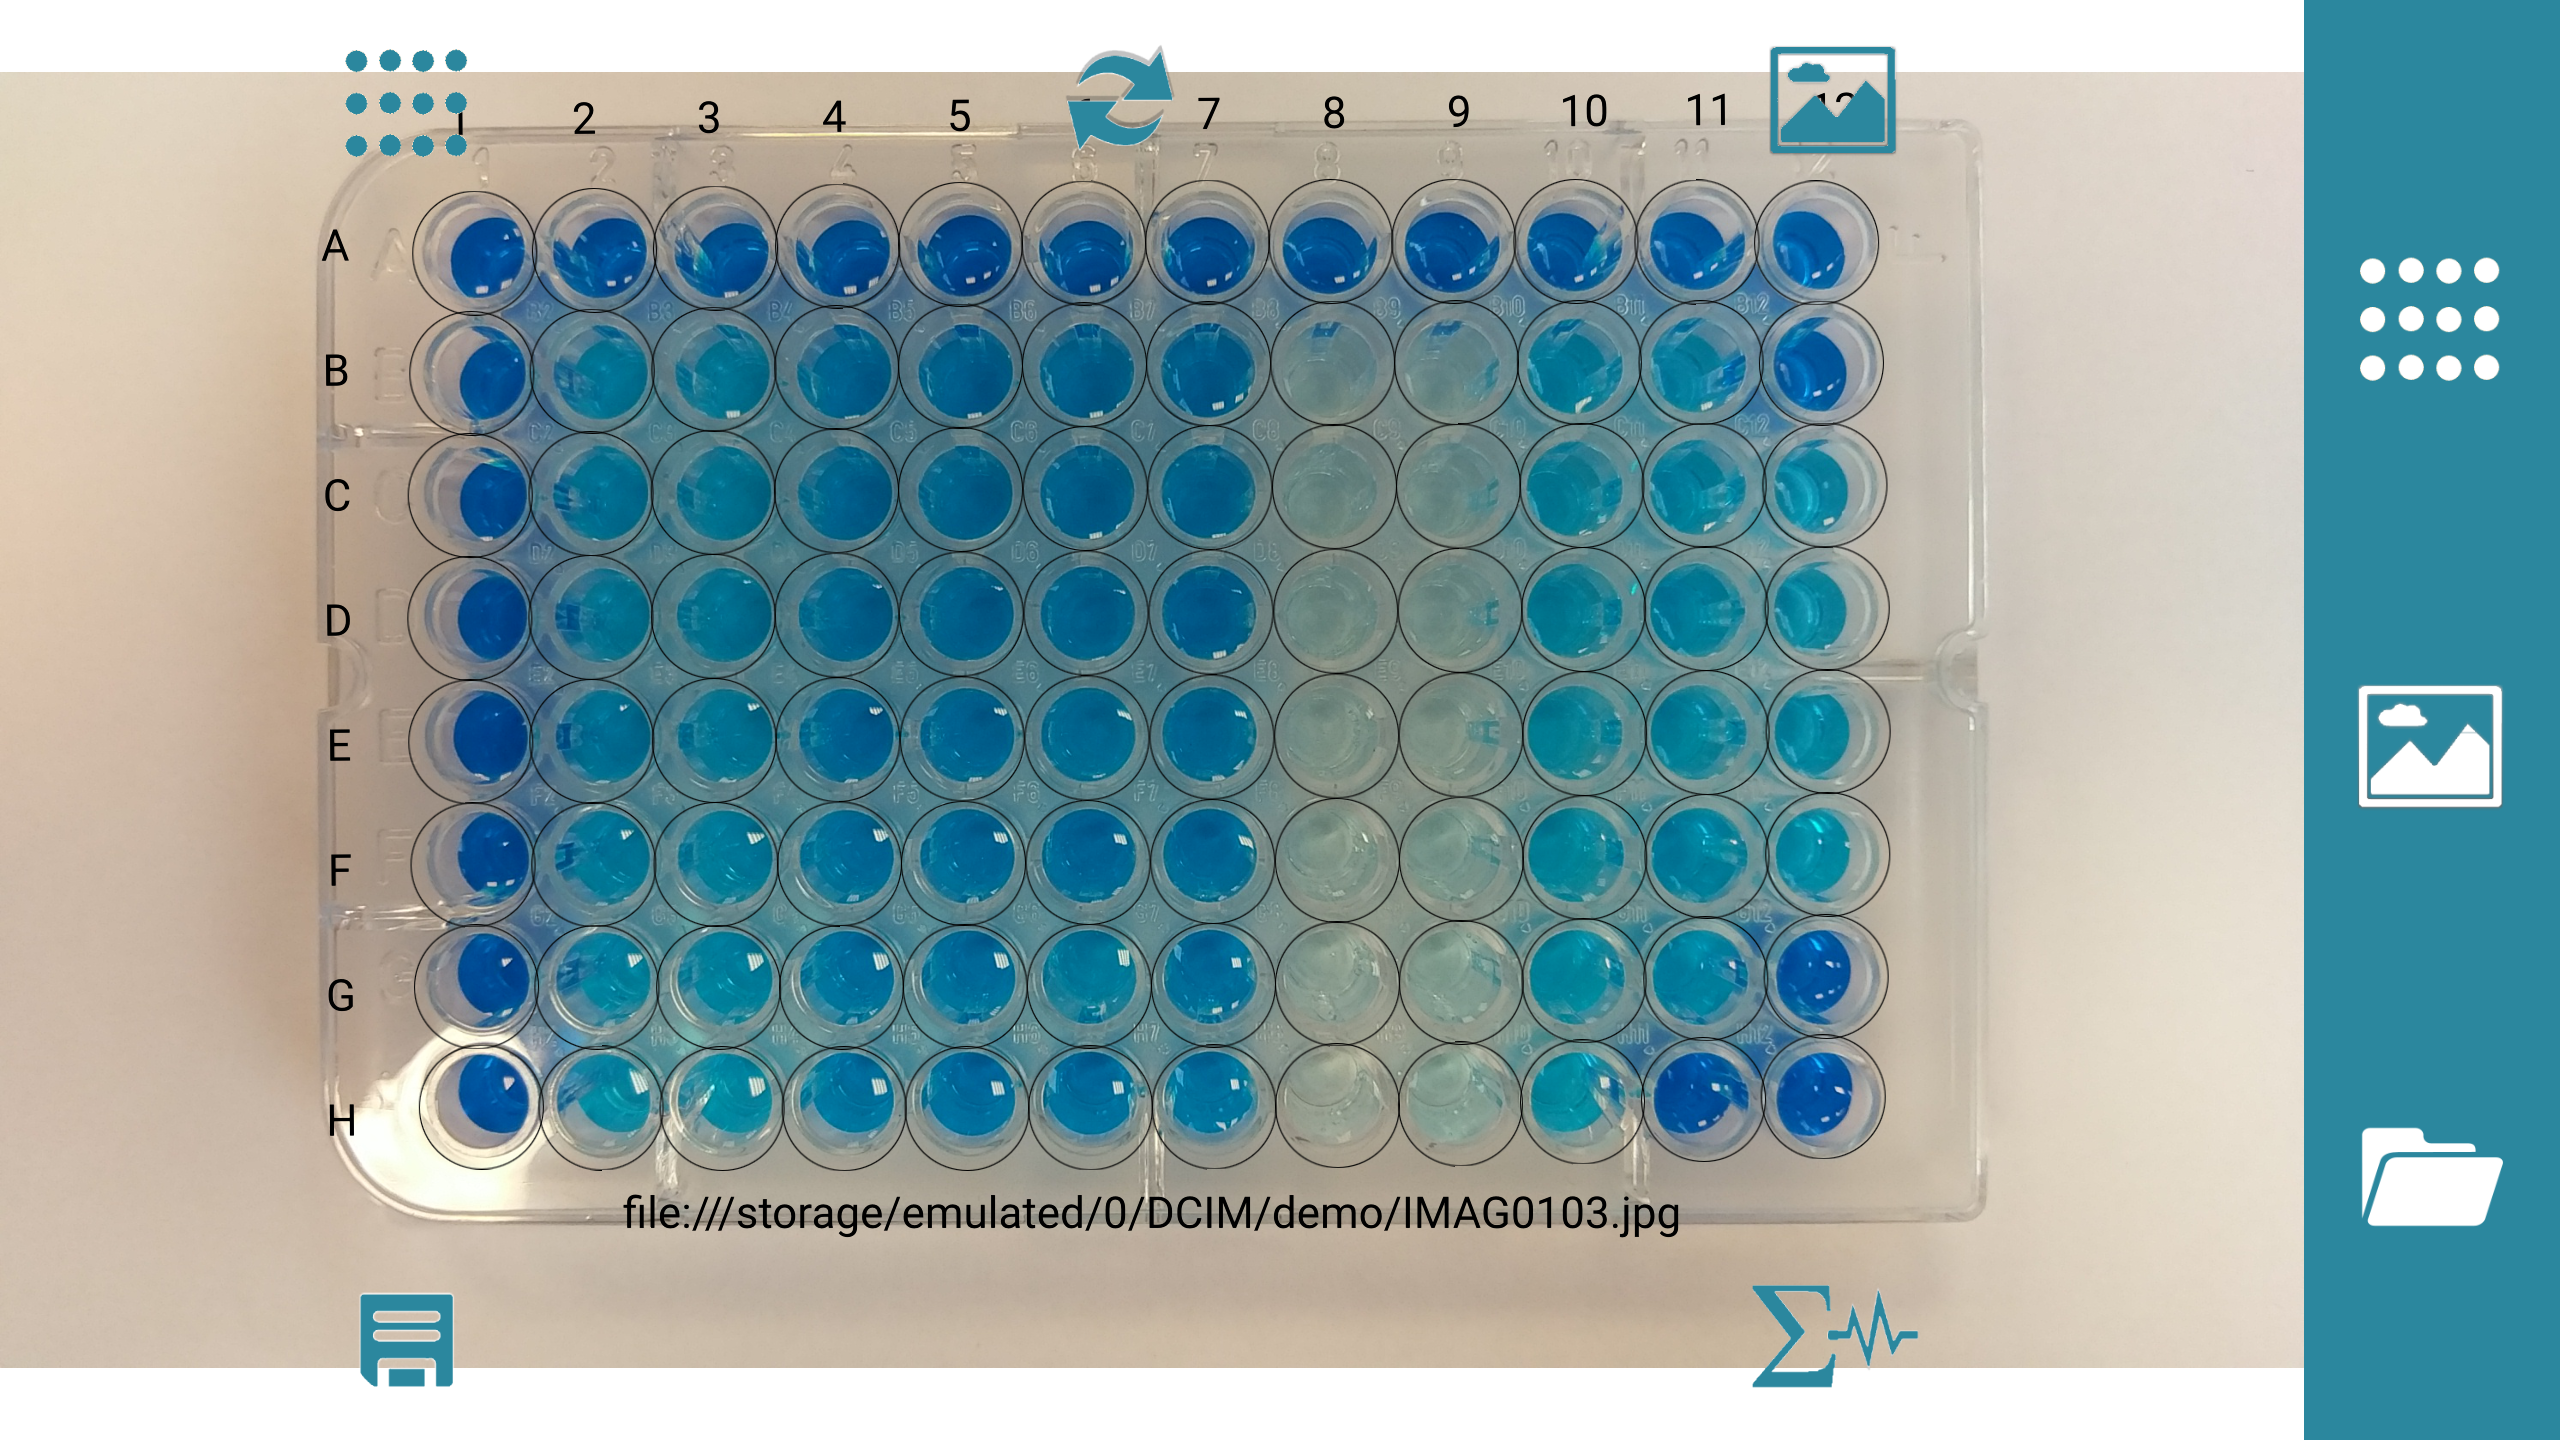
Figure 2: Plate alignment with the overlaying grid. Signal Detection and QuantificationWe start the quantification process after aligning the grid. The detection and quantification of wells’ signal takes just one or some minutes, depending on the smartphone processor and the image resolution. The grid is then hidden for viewing convenience. The detected signal in each well is marked with a red boundary (Figure 3). 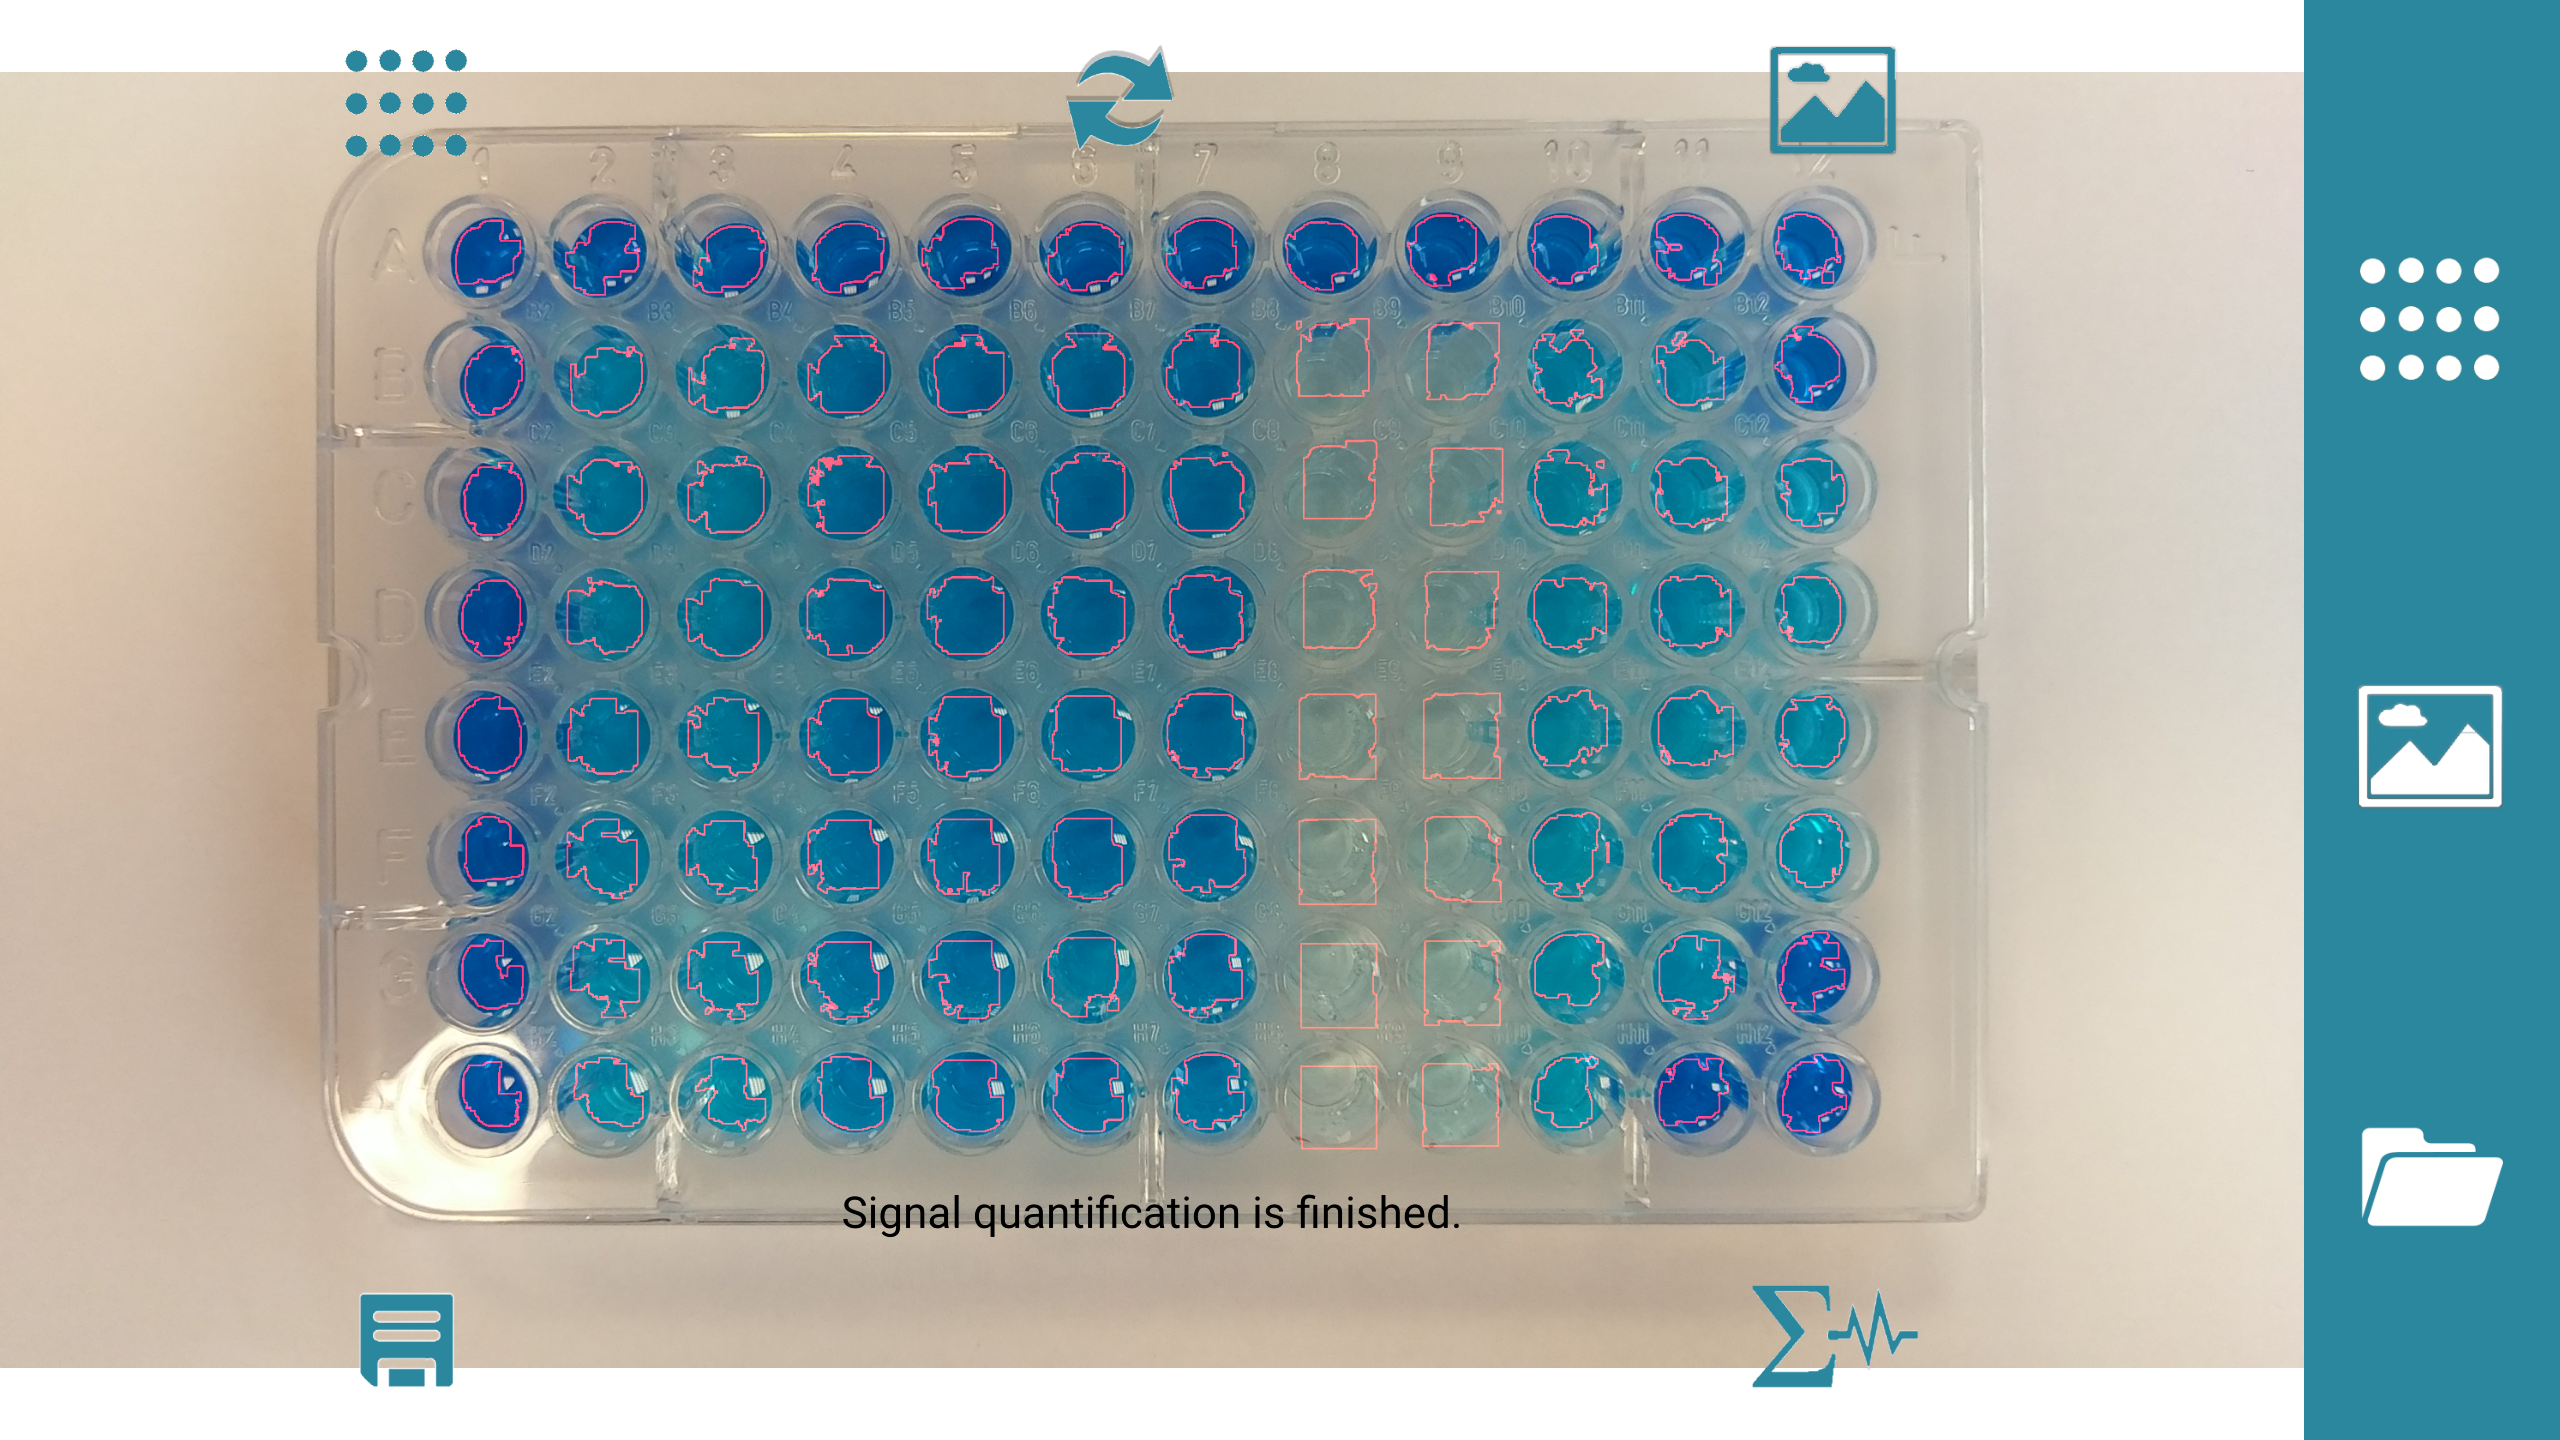
Figure 3. Detected signal with boundary highlighted in red. ResultsObserve the detected signal in Figure 3 and a close-up of the plate top-left corner in Figure 4. The red boundary can:
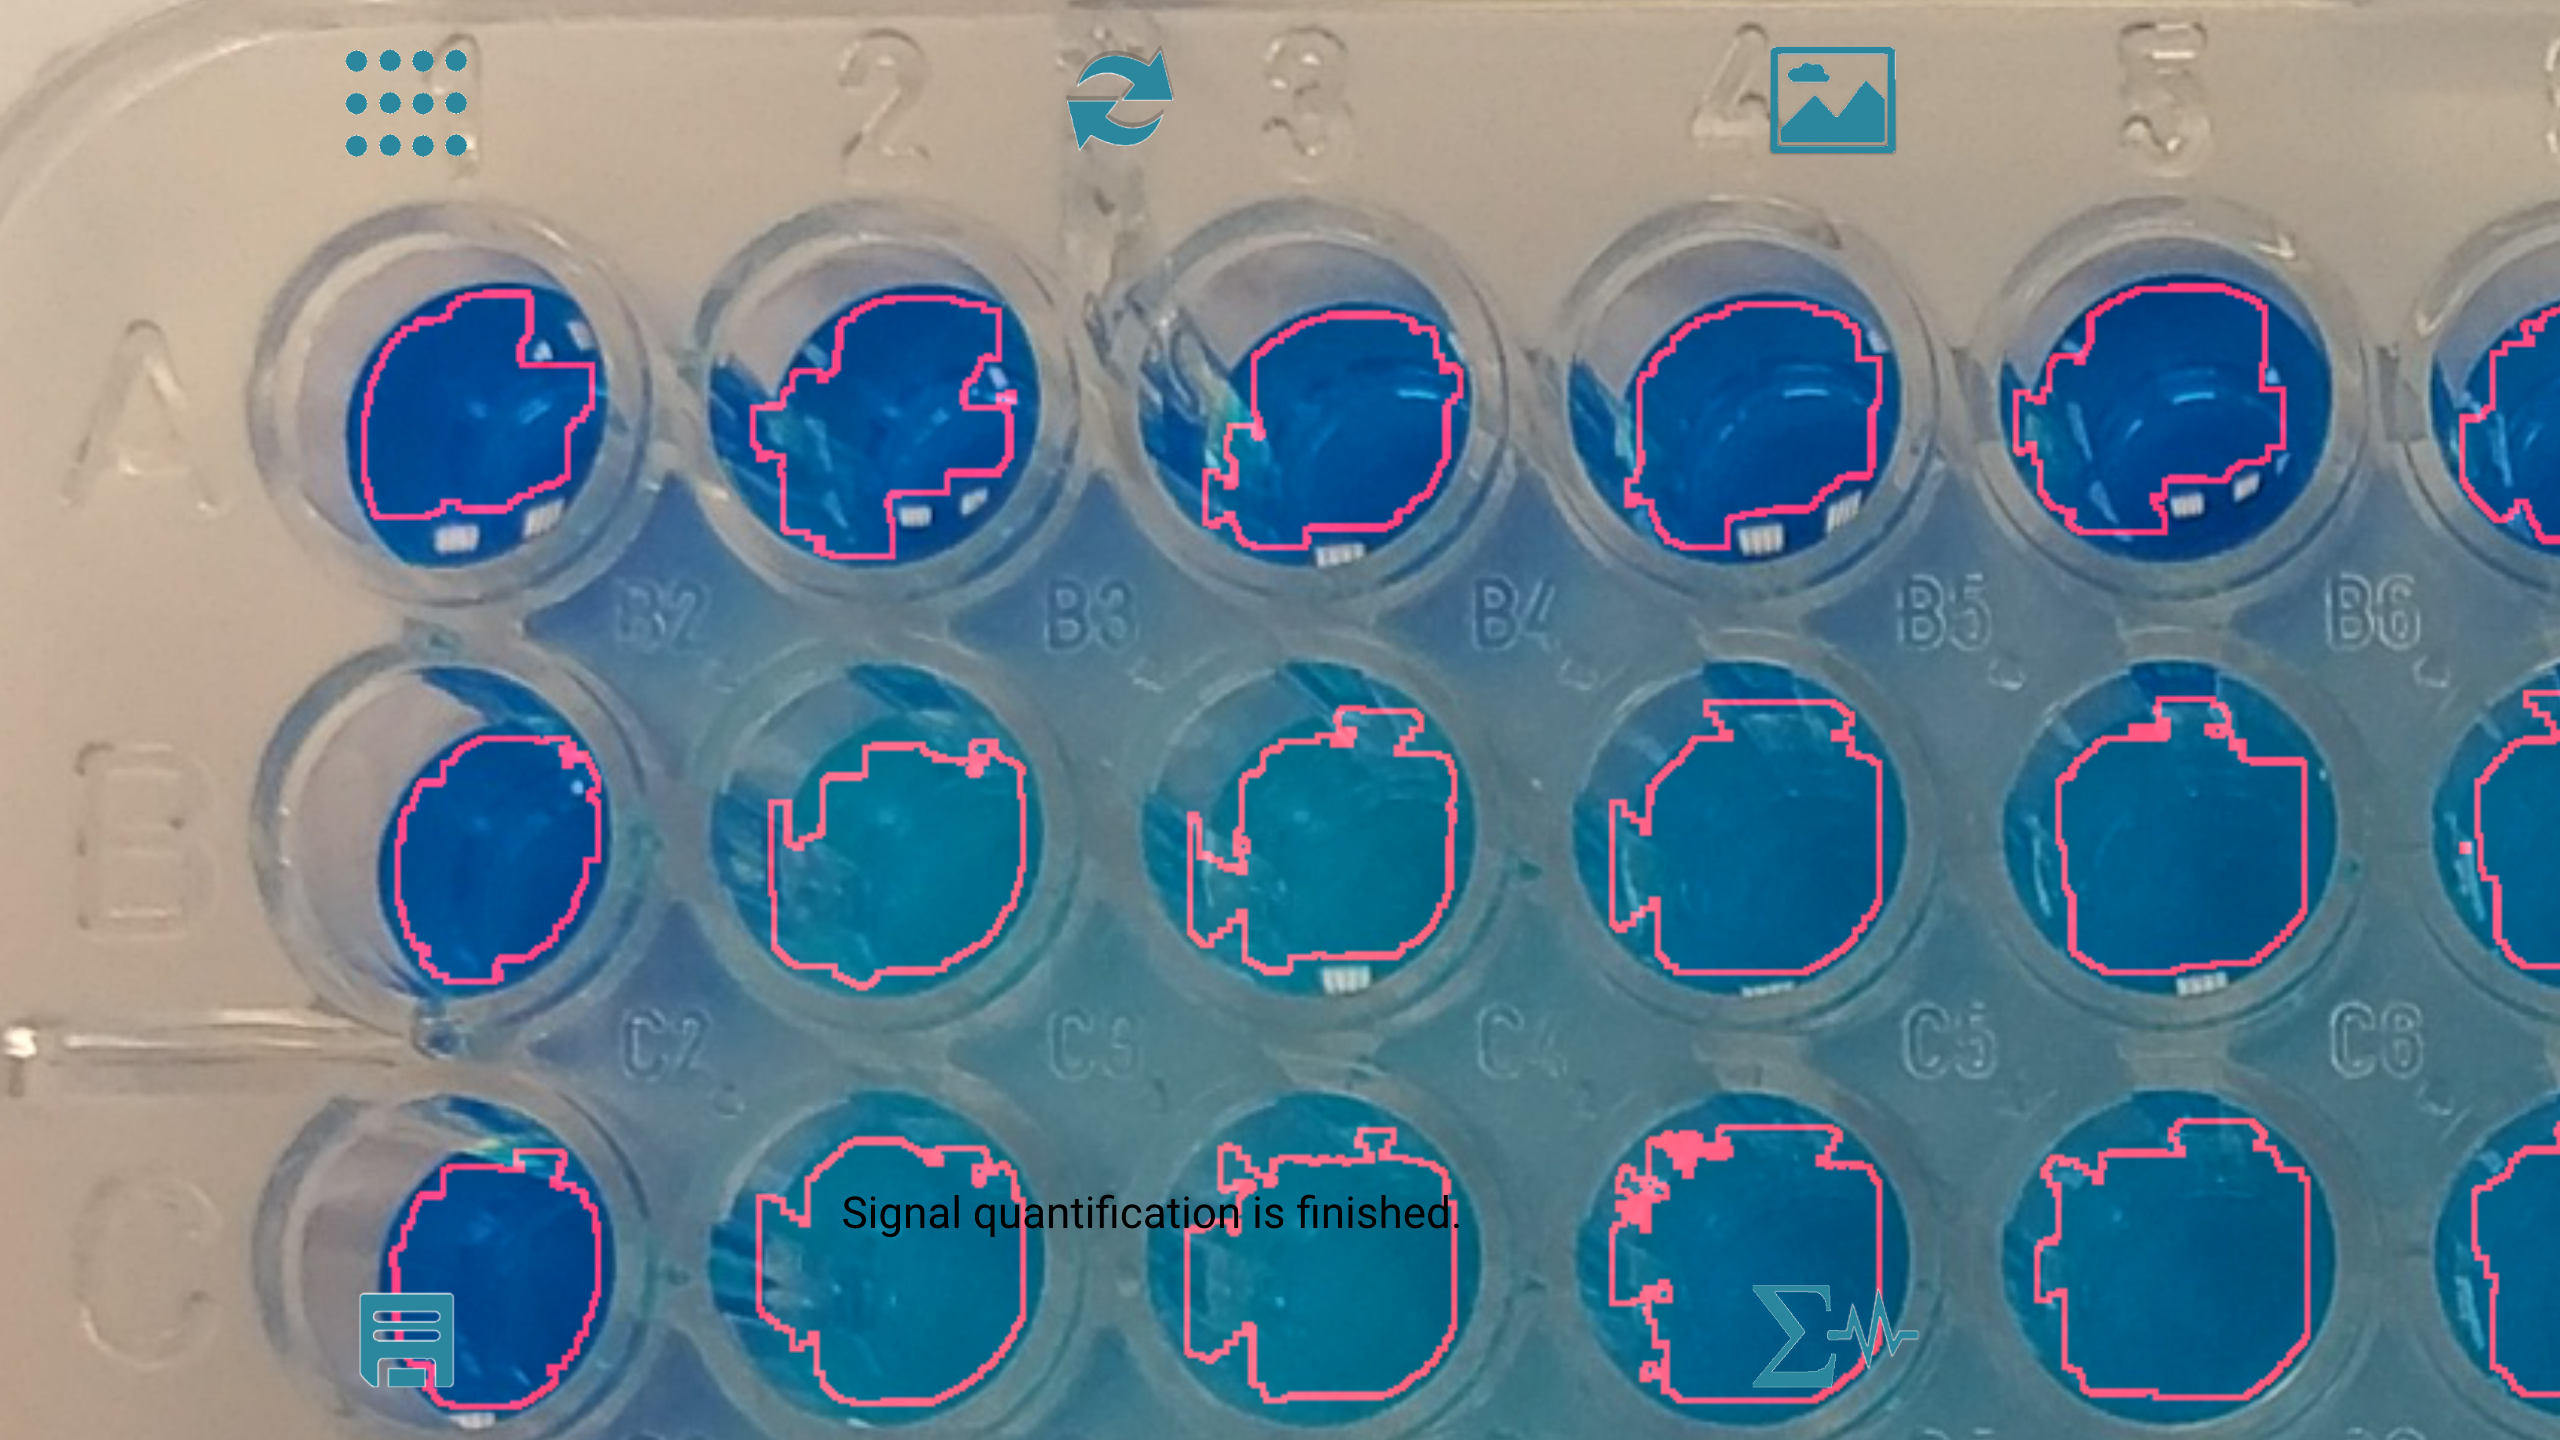
Figure 4: Close-up of the plate’s top-left region. The exception to the smearing processing is when the wells have no signal at all (columns 8 and 9); the detection algorithm needs improvement here. However, the problem could be resolved by specifying the wells as “Unused” or using a control which set the well signal level e.g. to zero. The wells’ color intensity value is reported in the classic table format (Figure 5). 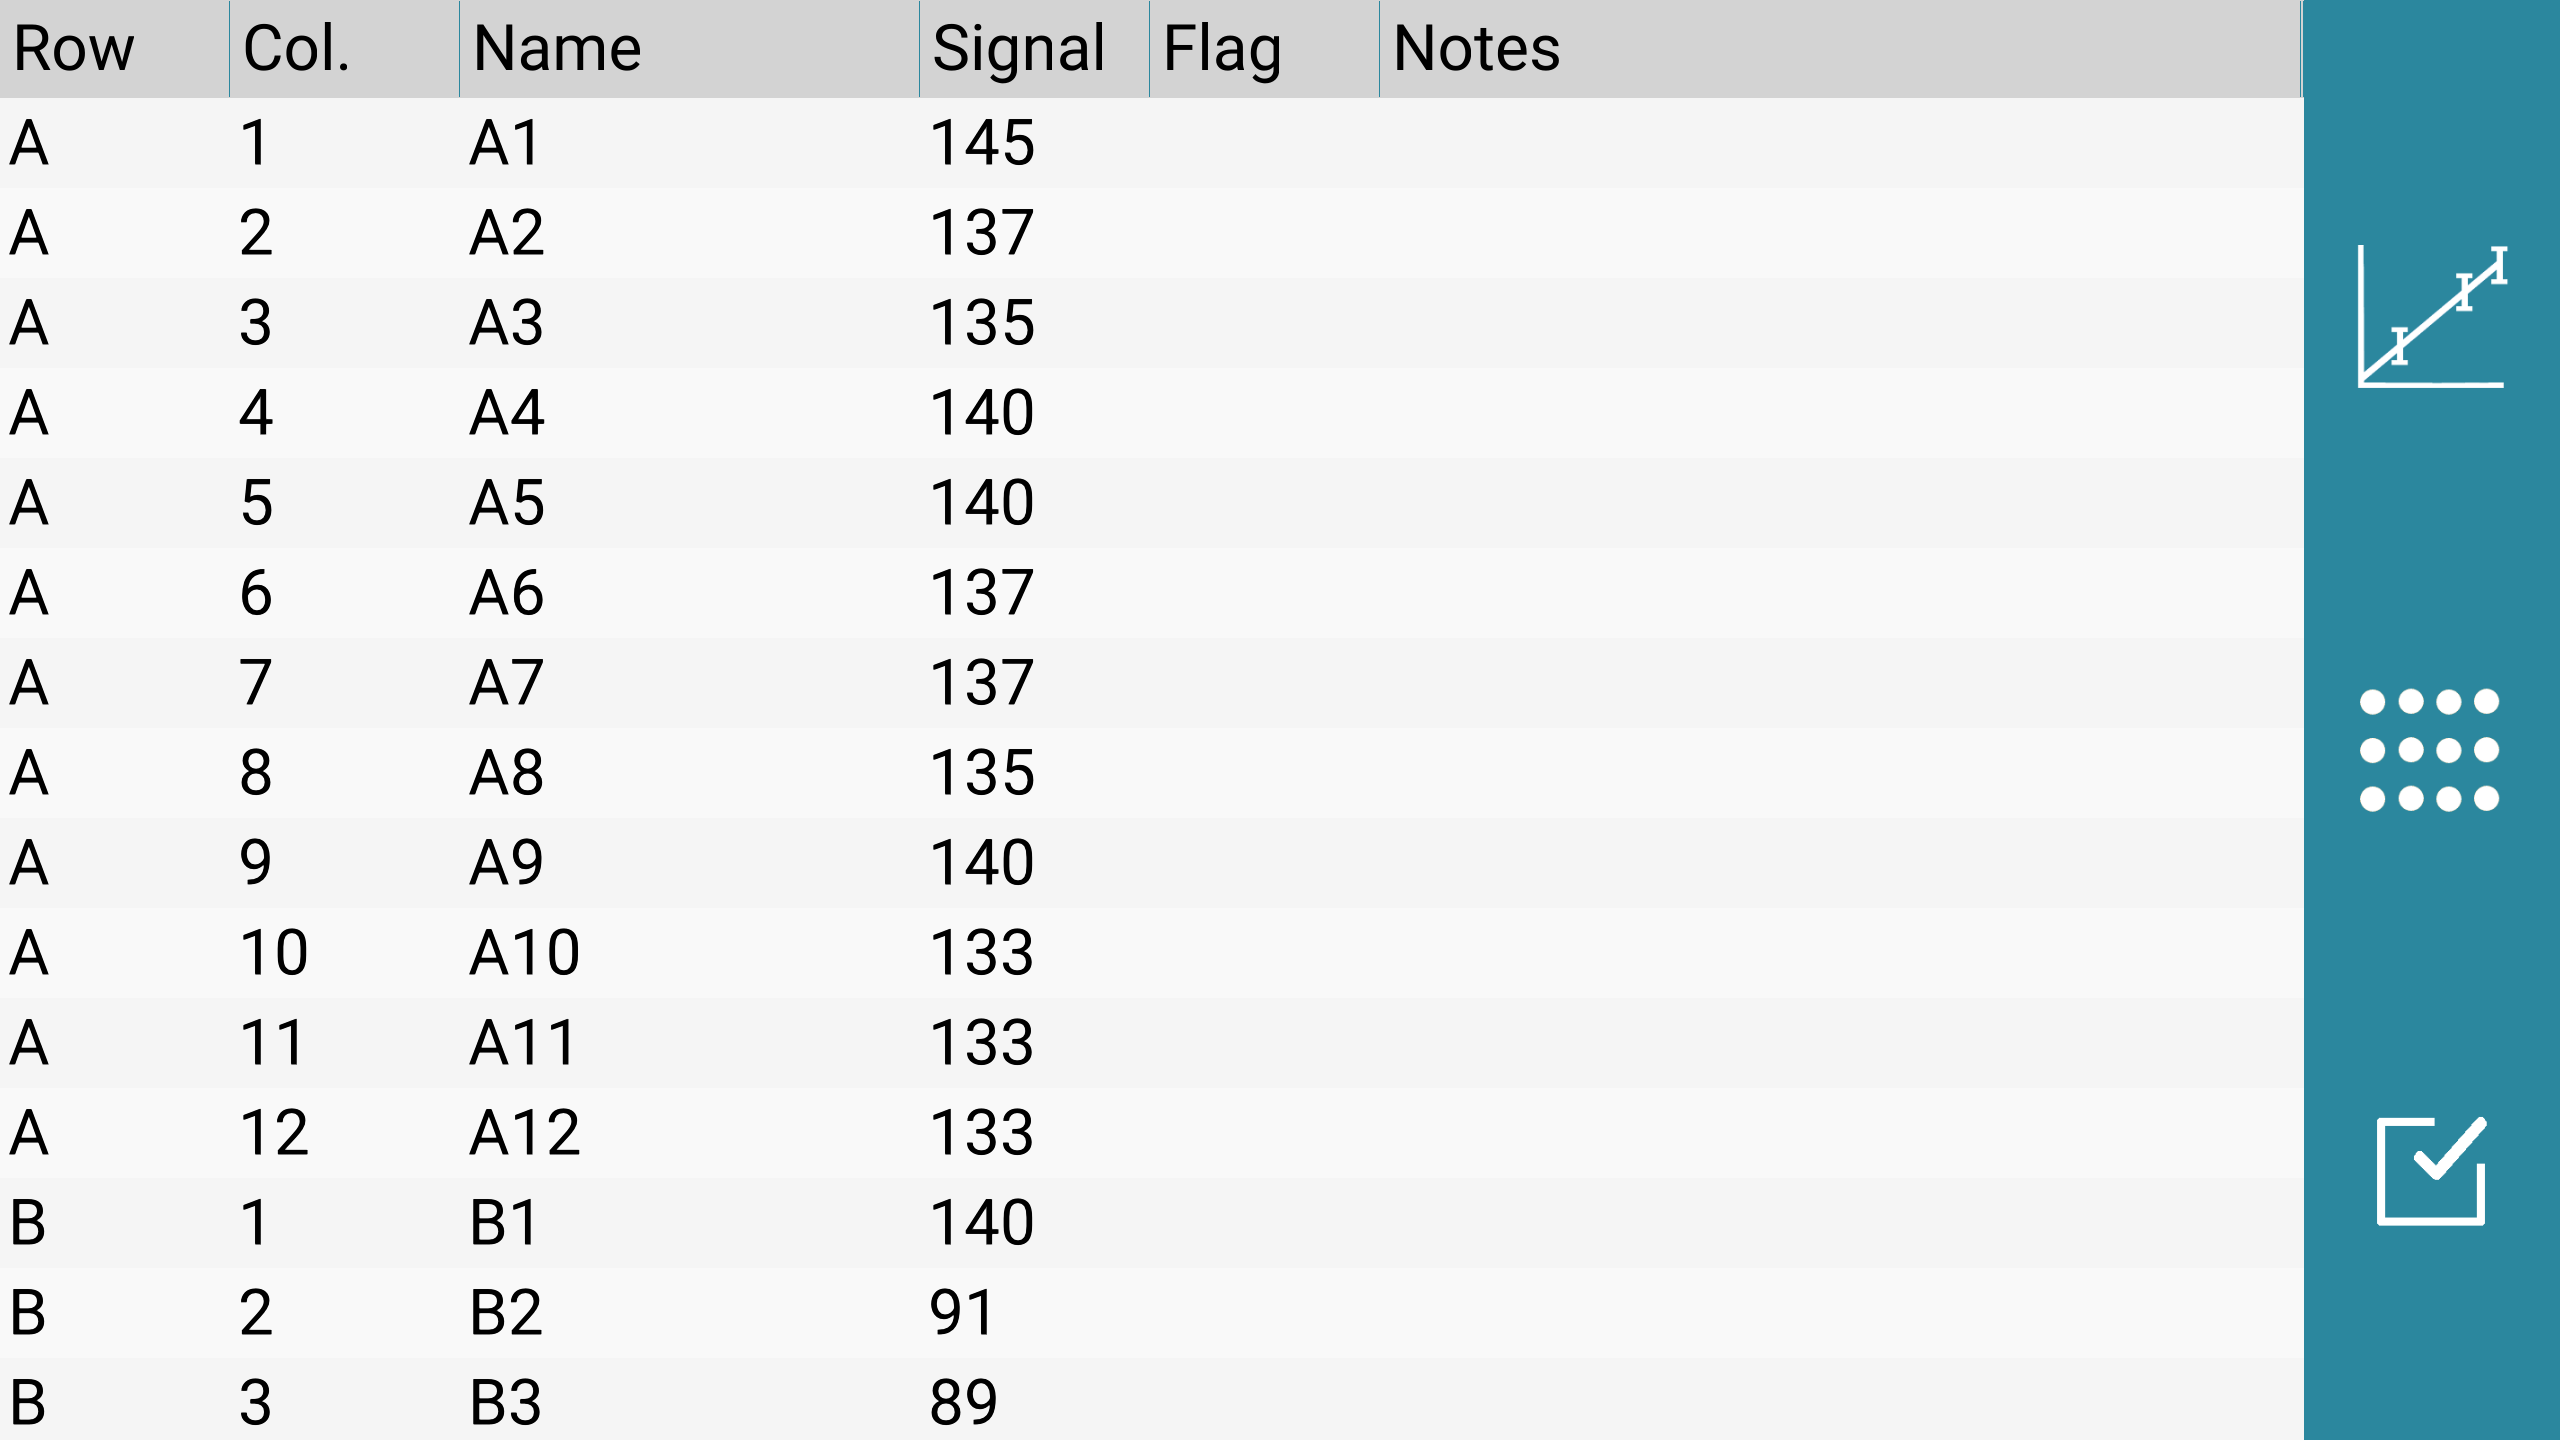
Figure 5: Table of wells’ signal value. In addition, the schematic plate (Figure 6) represents the wells’ signal level as colors. The overview of the wells’ signal and their annotation might be useful before finding the unknowns’ value with the standard curve. 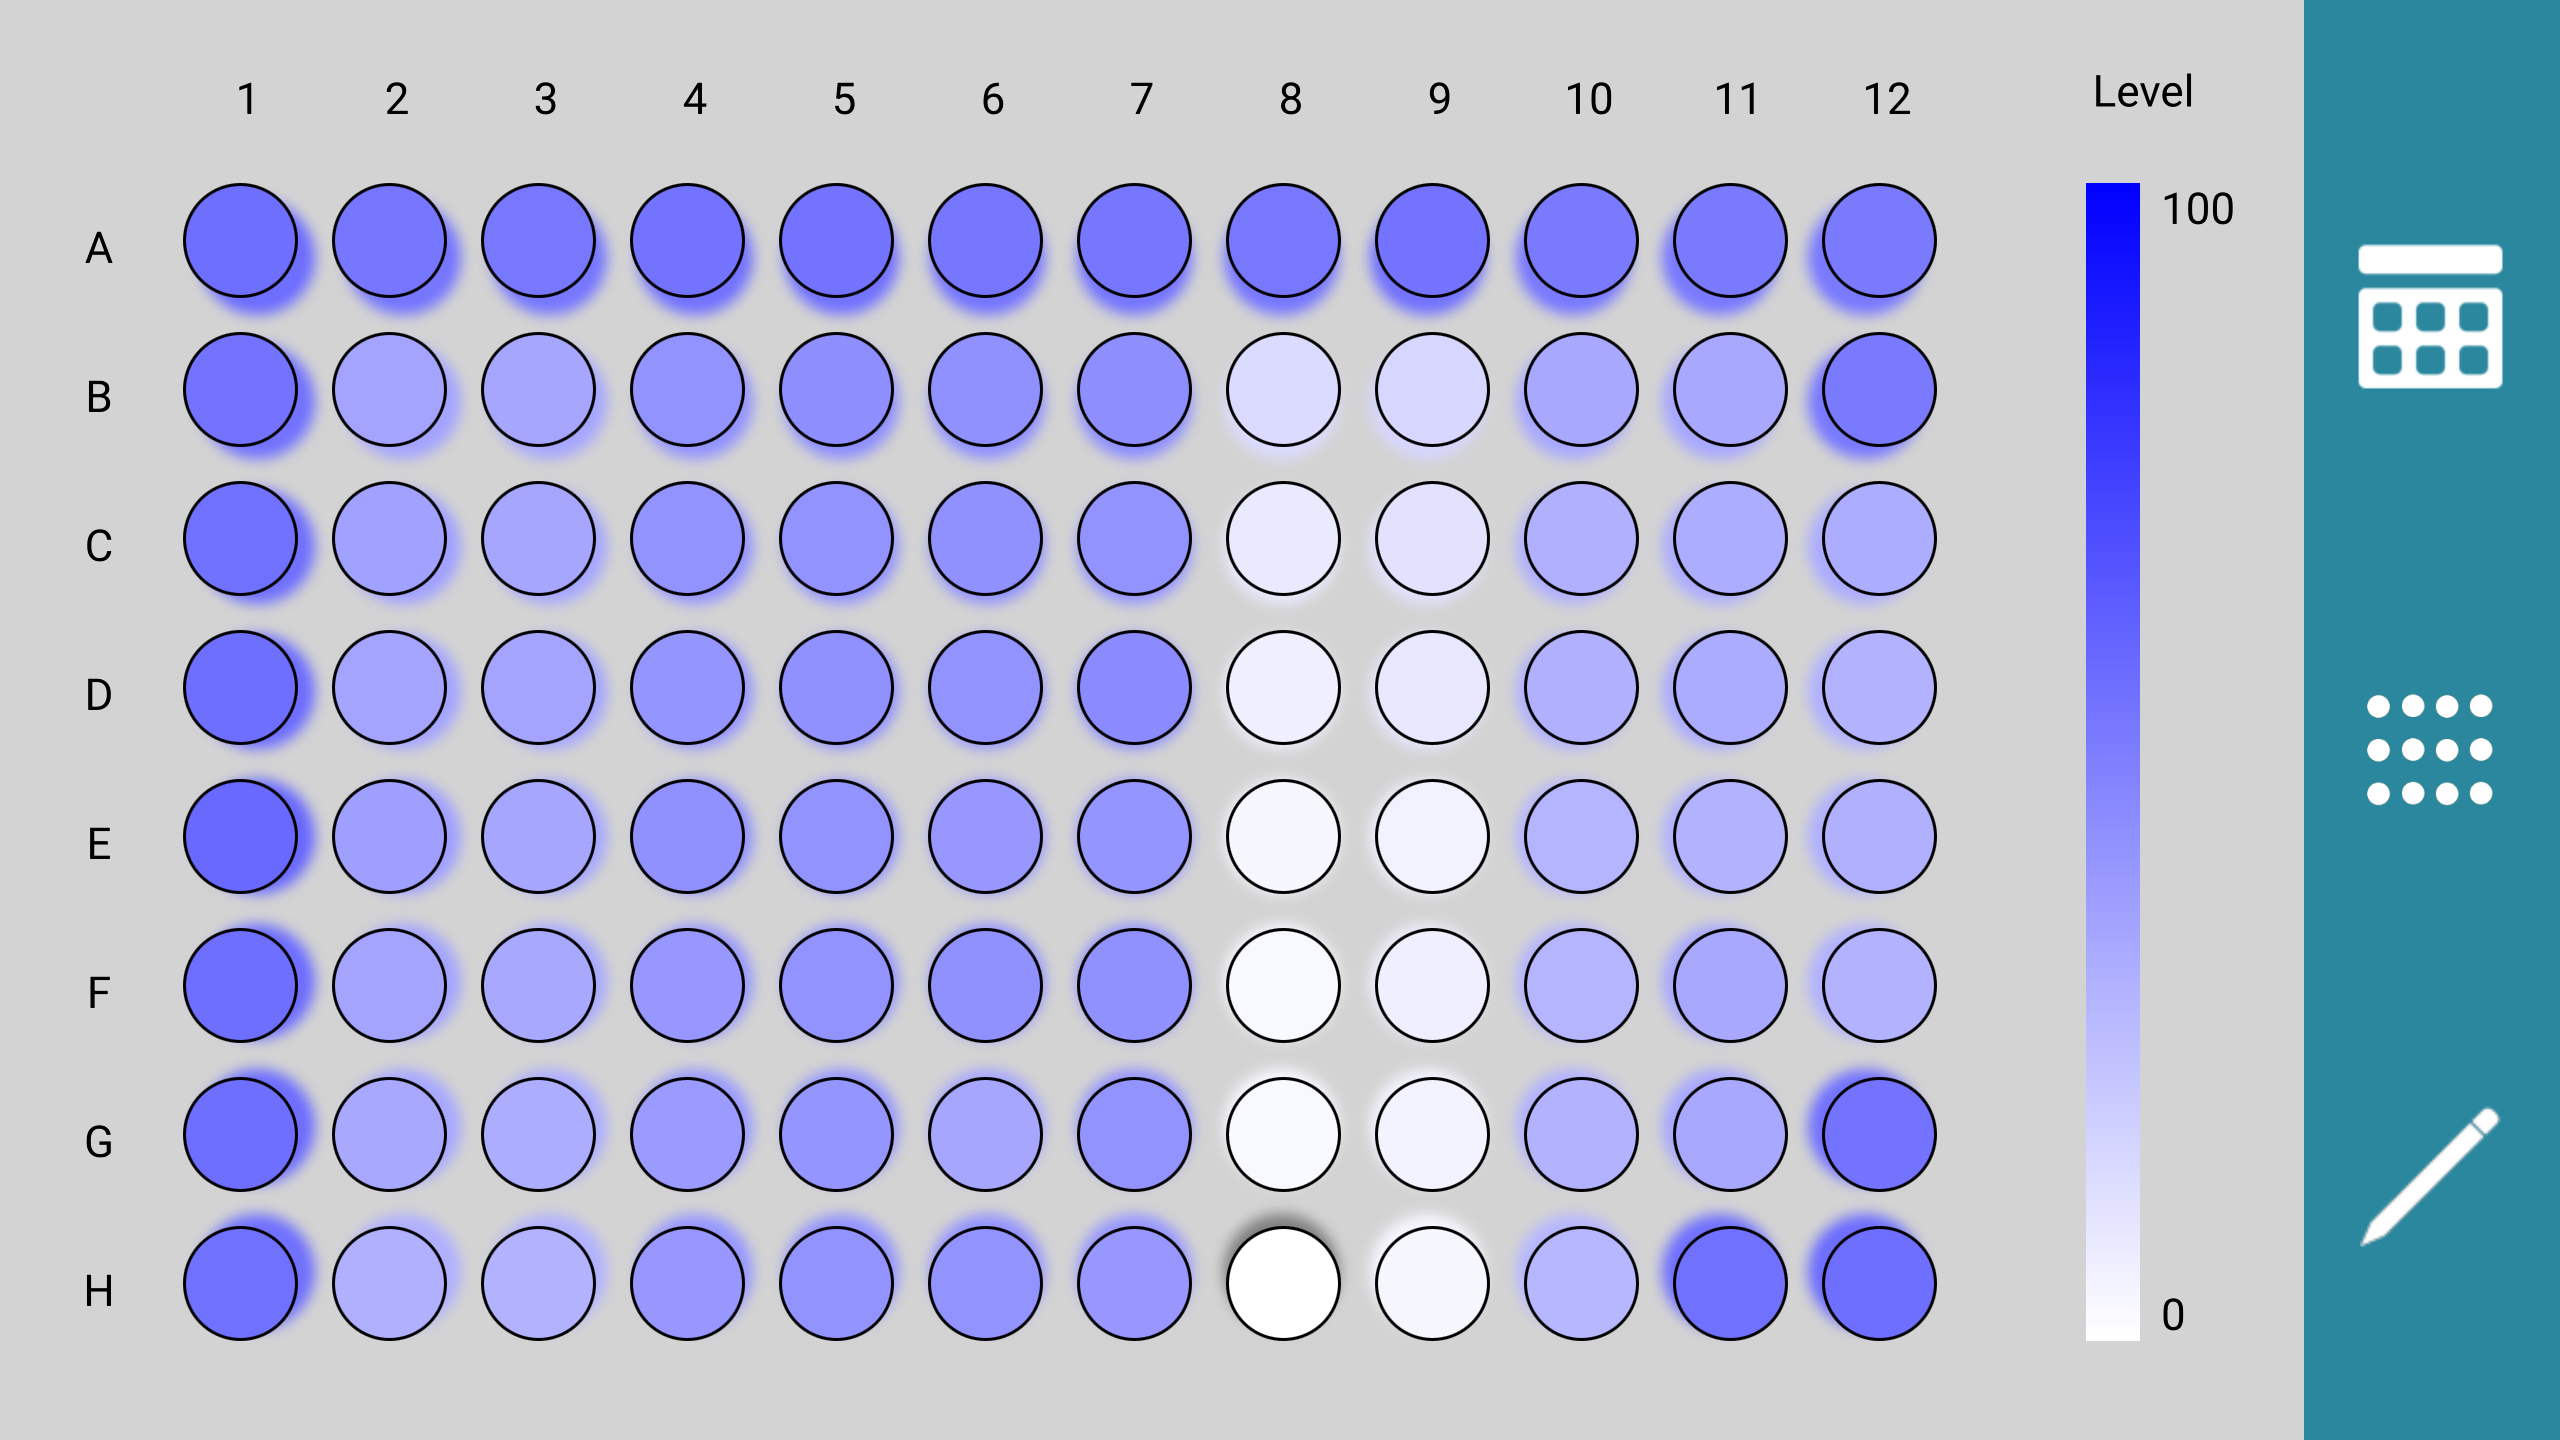
Figure 6: Schematic plate. |
|
ConclusionWe have shown how to capture and analyze images of a 96-well plate with the Spotxel® Reader app. The whole procedure just takes some minutes with a few touches on an Android smartphone. The technology is actually based on years of development and experience of our microarray image and data analysis software Spotxel®, with powerful noise processing and signal detection methods. The next newsletters will address the calibration task and deriving the assay unknowns’ value with a standard curve. We plan to release the Beta version of the Spotxel® Reader app for Android devices in early December. The Beta version for iPhones and iPads follows in early February. If you are interested in testing the app or have some special request, feel free to contact us. |
|
|
©2017 Sicasys Software GmbH. All Rights Reserved. |
|
|
Sicasys Software GmbH |
Web: www.sicasys.de |